Wells Fargo 2009 Annual Report Download - page 44
Download and view the complete annual report
Please find page 44 of the 2009 Wells Fargo annual report below. You can navigate through the pages in the report by either clicking on the pages listed below, or by using the keyword search tool below to find specific information within the annual report.-
 1
1 -
2
-
3
-
4
-
5
-
6
-
7
-
8
-
9
-
10
-
11
-
12
-
13
-
14
-
15
-
16
-
17
-
18
-
19
-
20
-
21
-
22
-
23
-
24
-
25
-
26
-
27
-
28
-
29
-
30
-
31
-
32
-
33
-
 34
34 -
 35
35 -
 36
36 -
 37
37 -
 38
38 -
 39
39 -
 40
40 -
 41
41 -
 42
42 -
 43
43 -
 44
44 -
 45
45 -
 46
46 -
 47
47 -
 48
48 -
 49
49 -
 50
50 -
 51
51 -
 52
52 -
 53
53 -
 54
54 -
55
-
56
-
57
-
58
-
59
-
60
-
61
-
62
-
63
-
64
-
65
-
66
-
67
-
68
-
69
-
70
-
71
-
72
-
73
-
74
-
75
-
76
-
77
-
78
-
79
-
80
-
81
-
82
-
83
-
84
-
85
-
86
-
87
-
88
-
89
-
90
-
91
-
92
-
93
-
94
-
95
-
96
-
97
-
98
-
99
-
100
-
101
-
102
-
103
-
104
-
105
-
106
-
107
-
108
-
109
-
110
-
111
-
112
-
113
-
114
-
115
-
116
-
117
-
118
-
119
-
120
-
121
-
122
-
123
-
124
-
125
-
126
-
127
-
128
-
129
-
130
-
131
-
132
-
133
-
134
-
135
-
136
-
137
-
138
-
139
-
140
-
141
-
142
-
143
-
144
-
145
-
146
-
147
-
148
-
149
-
150
-
151
-
152
-
153
-
154
-
155
-
156
-
157
-
158
-
159
-
160
-
161
-
162
-
163
-
164
-
165
-
166
-
167
-
168
-
169
-
170
-
171
-
172
-
173
-
174
-
175
-
176
-
177
-
178
-
179
-
180
-
181
-
182
-
183
-
184
-
185
-
186
-
187
-
188
-
189
-
190
-
191
-
192
-
193
-
194
-
195
-
196
 |
 |

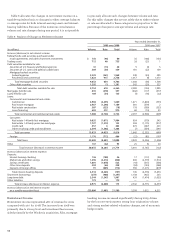
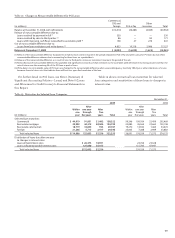
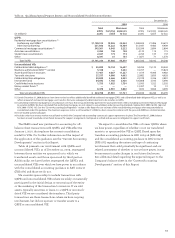
Table 6: Analysis of Changes in Net Interest Income
Year ended December 31,
2009 over 2008 2008 over 2007
(in millions) Volume Rate Total Volume Rate Total
Increase (decrease) in net interest income:
Federal funds sold, securities purchased under
resale agreements and other short-term investments $ 156 (96) 60 35 (168) (133)
Trading assets 715 40 755 26 (25) 1
Debt securities available for sale:
Securities of U.S. Treasury and federal agencies 41 (13) 28 9(4)5
Securities of U.S. states and political subdivisions 369 (30) 339 181 (22) 159
Mortgage-backed securities:
Federal agencies 2,229 (261) 1,968 349 (54) 295
Residential and commercial 1,823 915 2,738 1,017 (4) 1,013
Total mortgage-backed securities 4,052 654 4,706 1,366 (58) 1,308
Other debt securities 1,292 (1) 1,291 543 (20) 523
Total debt securities available for sale 5,754 610 6,364 2,099 (104) 1,995
Mortgages held for sale 635 (278) 357 (460) (117) (577)
Loans held for sale 169 (34) 135 (4) (18) (22)
Loans:
Commercial and commercial real estate:
Commercial 3,904 (2,295) 1,609 1,471 (1,804) (333)
Real estate mortgage 2,467 (1,298) 1,169 581 (579) 2
Real estate construction 507 (525) (18) 176 (509) (333)
Lease financing 602 372 974 69 (14) 55
Total commercial and commercial real estate 7,480 (3,746) 3,734 2,297 (2,906) (609)
Consumer:
Real estate 1-4 family first mortgage 9,055 (1,071) 7,984 924 (379) 545
Real estate 1-4 family junior lien mortgage 1,727 (1,572) 155 258 (1,175) (917)
Credit card 457 6 463 470 (247) 223
Other revolving credit and installment 2,594 (1,386) 1,208 (7) (534) (541)
Total consumer 13,833 (4,023) 9,810 1,645 (2,335) (690)
Foreign 1,176 (712) 464 (22) (85) (107)
Total loans 22,489 (8,481) 14,008 3,920 (5,326) (1,406)
Other 137 (42) 95 25 (5) 20
Total increase (decrease) in interest income 30,055 (8,281) 21,774 5,641 (5,763) (122)
Increase (decrease) in interest expense:
Deposits:
Interest-bearing checking 136 (100) 36 17 (113) (96)
Market rate and other savings 1,396 (2,216) (820) 469 (2,379) (1,910)
Savings certificates 1,601 (1,078) 523 (43) (515) (558)
Other time deposits 294 (66) 228 (94) (154) (248)
Deposits in foreign offices 91 (805) (714) 396 (1,215) (819)
Total interest-bearing deposits 3,518 (4,265) (747) 745 (4,376) (3,631)
Short-term borrowings (259) (988) (1,247) 1,158 (925) 233
Long-term debt 3,544 (1,547) 1,997 439 (1,474) (1,035)
Other liabilities 172 — 172 ———
Total increase (decrease) in interest expense 6,975 (6,800) 175 2,342 (6,775) (4,433)
Increase (decrease) in net interest income
on a taxable-equivalent basis $23,080 (1,481) 21,599 3,299 1,012 4,311
Table 6 allocates the changes in net interest income on a
taxable-equivalent basis to changes in either average balances
or average rates for both interest-earning assets and interest-
bearing liabilities. Because of the numerous simultaneous
volume and rate changes during any period, it is not possible
to precisely allocate such changes between volume and rate.
For this table, changes that are not solely due to either volume
or rate are allocated to these categories in proportion to the
percentage changes in average volume and average rate.
Noninterest Income
Noninterest income represented 48% of revenue for 2009
compared with 40% for 2008. The increase from 2008 was
primarily due to strong trust and investment fee income,
aided primarily by the Wachovia acquisition. Also, mortgage
banking income increased significantly during 2009 driven
by the low rate environment, strong loan origination volume
and strong market-related valuation changes, net of economic
hedge results.