Wells Fargo 2009 Annual Report Download - page 157
Download and view the complete annual report
Please find page 157 of the 2009 Wells Fargo annual report below. You can navigate through the pages in the report by either clicking on the pages listed below, or by using the keyword search tool below to find specific information within the annual report.-
 1
1 -
2
-
3
-
4
-
5
-
6
-
7
-
8
-
9
-
10
-
11
-
12
-
13
-
14
-
15
-
16
-
17
-
18
-
19
-
20
-
21
-
22
-
23
-
24
-
25
-
26
-
27
-
28
-
29
-
30
-
31
-
32
-
33
-
34
-
35
-
36
-
37
-
38
-
39
-
40
-
41
-
42
-
43
-
44
-
45
-
46
-
47
-
48
-
49
-
50
-
51
-
52
-
53
-
54
-
55
-
56
-
57
-
58
-
59
-
60
-
61
-
62
-
63
-
64
-
65
-
66
-
67
-
68
-
69
-
70
-
71
-
72
-
73
-
74
-
75
-
76
-
77
-
78
-
79
-
80
-
81
-
82
-
83
-
84
-
85
-
86
-
87
-
88
-
89
-
90
-
91
-
92
-
93
-
94
-
95
-
96
-
97
-
98
-
99
-
100
-
101
-
102
-
103
-
104
-
105
-
106
-
107
-
108
-
109
-
110
-
111
-
112
-
113
-
114
-
115
-
116
-
117
-
118
-
119
-
120
-
121
-
122
-
123
-
124
-
125
-
126
-
127
-
128
-
129
-
130
-
131
-
132
-
133
-
134
-
135
-
136
-
137
-
138
-
139
-
140
-
141
-
142
-
143
-
144
-
145
-
146
-
 147
147 -
 148
148 -
 149
149 -
 150
150 -
 151
151 -
 152
152 -
 153
153 -
 154
154 -
 155
155 -
 156
156 -
 157
157 -
 158
158 -
 159
159 -
 160
160 -
 161
161 -
 162
162 -
 163
163 -
 164
164 -
 165
165 -
 166
166 -
 167
167 -
168
-
169
-
170
-
171
-
172
-
173
-
174
-
175
-
176
-
177
-
178
-
179
-
180
-
181
-
182
-
183
-
184
-
185
-
186
-
187
-
188
-
189
-
190
-
191
-
192
-
193
-
194
-
195
-
196
 |
 |

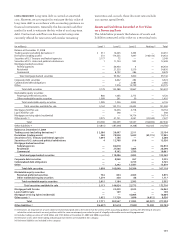
maturities and, as such, these discount rates include
our current spread levels.
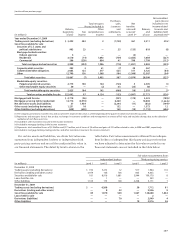
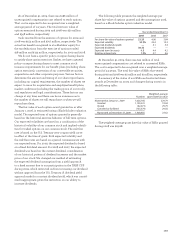
Assets and Liabilities Recorded at Fair Value
on a Recurring Basis
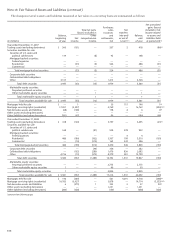
The table below presents the balances of assets and
liabilities measured at fair value on a recurring basis.
LONG-TERM DEBT Long-term debt is carried at amortized
cost. However, we are required to estimate the fair value of
long-term debt in accordance with accounting guidance on
financial instruments. Generally, the discounted cash flow
method is used to estimate the fair value of our long-term
debt. Contractual cash flows are discounted using rates
currently offered for new notes with similar remaining
(in millions) Level 1 Level 2 Level 3 Netting(1) Total
Balance at December 31, 2008
Trading assets (excluding derivatives) (2) $ 911 16,045 3,495 — 20,451
Derivatives (trading assets) 331 174,355 7,897 (148,150) 34,433
Securities of U.S. Treasury and federal agencies 3,177 72 — — 3,249
Securities of U.S. states and political subdivisions 1 11,754 903 — 12,658
Mortgage-backed securities:
Federal agencies — 66,430 4 — 66,434
Residential — 21,320 3,510 — 24,830
Commercial — 8,192 286 — 8,478
Total mortgage-backed securities — 95,942 3,800 — 99,742
Corporate debt securities — 6,642 282 — 6,924
Collateralized debt obligations — 2 2,083 — 2,085
Other — 7,976 12,799 — 20,775
Total debt securities 3,178 122,388 19,867 — 145,433
Marketable equity securities:
Perpetual preferred securities 886 1,065 2,775 — 4,726
Other marketable equity securities 1,099 261 50 — 1,410
Total marketable equity securities 1,985 1,326 2,825 — 6,136
Total securities available for sale 5,163 123,714 22,692 — 151,569
Mortgages held for sale — 14,036 4,718 — 18,754
Loans held for sale — 398 — — 398
Mortgage servicing rights (residential) — — 14,714 — 14,714
Other assets (3) 3,975 21,751 2,041 (20,540) 7,227
Total $10,380 350,299 55,557 (168,690) 247,546
Other liabilities (4) $ (4,815) (187,098) (9,308) 182,435 (18,786)
Balance at December 31, 2009
Trading assets (excluding derivatives) (2) $ 2,386 20,497 2,311 — 25,194
Derivatives (trading assets) 340 70,938 5,682 (59,115) 17,845
Securities of U.S. Treasury and federal agencies 1,094 1,186 — — 2,280
Securities of U.S. states and political subdivisions 4 12,708 818 — 13,530
Mortgage-backed securities:
Federal agencies — 82,818 — — 82,818
Residential — 27,506 1,084 — 28,590
Commercial — 9,162 1,799 — 10,961
Total mortgage-backed securities — 119,486 2,883 — 122,369
Corporate debt securities — 8,968 367 — 9,335
Collateralized debt obligations — — 3,725 — 3,725
Other — 3,292 12,587 — 15,879
Total debt securities 1,098 145,640 20,380 — 167,118
Marketable equity securities:
Perpetual preferred securities 736 834 2,305 — 3,875
Other marketable equity securities 1,279 350 88 — 1,717
Total marketable equity securities 2,015 1,184 2,393 — 5,592
Total securities available for sale 3,113 146,824 22,773 — 172,710
Mortgages held for sale — 33,439 3,523 — 36,962
Loans held for sale — 149 — — 149
Mortgage servicing rights (residential) — — 16,004 — 16,004
Other assets (3) 1,932 11,720 1,690 (6,812) 8,530
Total $ 7,771 283,567 51,983 (65,927) 277,394
Other liabilities (4) $(6,527) (81,613) (7,942) 73,299 (22,783)
(1) Derivatives are reported net of cash collateral received and paid and, to the extent that the criteria of the accounting guidance covering the offsetting of amounts
related to certain contracts are met, positions with the same counterparty are netted as part of a legally enforceable master netting agreement.
(2) Includes trading securities of $24.0 billion and $19.5 billion at December 31, 2009 and 2008, respectively.
(3) Derivative assets other than trading and principal investments are included in this category.
(4) Derivative liabilities are included in this category.