Wells Fargo 2009 Annual Report Download - page 185
Download and view the complete annual report
Please find page 185 of the 2009 Wells Fargo annual report below. You can navigate through the pages in the report by either clicking on the pages listed below, or by using the keyword search tool below to find specific information within the annual report.-
 1
1 -
2
-
3
-
4
-
5
-
6
-
7
-
8
-
9
-
10
-
11
-
12
-
13
-
14
-
15
-
16
-
17
-
18
-
19
-
20
-
21
-
22
-
23
-
24
-
25
-
26
-
27
-
28
-
29
-
30
-
31
-
32
-
33
-
34
-
35
-
36
-
37
-
38
-
39
-
40
-
41
-
42
-
43
-
44
-
45
-
46
-
47
-
48
-
49
-
50
-
51
-
52
-
53
-
54
-
55
-
56
-
57
-
58
-
59
-
60
-
61
-
62
-
63
-
64
-
65
-
66
-
67
-
68
-
69
-
70
-
71
-
72
-
73
-
74
-
75
-
76
-
77
-
78
-
79
-
80
-
81
-
82
-
83
-
84
-
85
-
86
-
87
-
88
-
89
-
90
-
91
-
92
-
93
-
94
-
95
-
96
-
97
-
98
-
99
-
100
-
101
-
102
-
103
-
104
-
105
-
106
-
107
-
108
-
109
-
110
-
111
-
112
-
113
-
114
-
115
-
116
-
117
-
118
-
119
-
120
-
121
-
122
-
123
-
124
-
125
-
126
-
127
-
128
-
129
-
130
-
131
-
132
-
133
-
134
-
135
-
136
-
137
-
138
-
139
-
140
-
141
-
142
-
143
-
144
-
145
-
146
-
147
-
148
-
149
-
150
-
151
-
152
-
153
-
154
-
155
-
156
-
157
-
158
-
159
-
160
-
161
-
162
-
163
-
164
-
165
-
166
-
167
-
168
-
169
-
170
-
171
-
172
-
173
-
174
-
 175
175 -
 176
176 -
 177
177 -
 178
178 -
 179
179 -
 180
180 -
 181
181 -
 182
182 -
 183
183 -
 184
184 -
 185
185 -
 186
186 -
 187
187 -
 188
188 -
 189
189 -
 190
190 -
 191
191 -
 192
192 -
 193
193 -
 194
194 -
 195
195 -
196
 |
 |

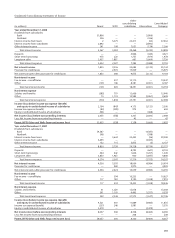
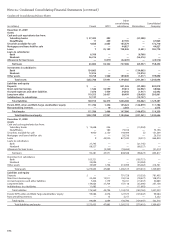
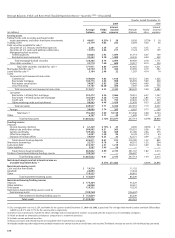
Condensed Consolidating Statements of Cash Flows
Year ended December 31,
2009 2008
Other Other
consolidating consolidating
subsidiaries/ Consolidated subsidiaries/ Consolidated
(in millions) Parent WFFI eliminations Company Parent WFFI eliminations Company
Cash flows from operating activities:
Net cash provided (used)
by operating activities $ 7,356 1,655 19,602 28,613 730 2,023 (7,541) (4,788)
Cash flows from investing activities:
Securities available for sale:
Sales proceeds 1,184 925 50,929 53,038 2,570 875 57,361 60,806
Prepayments and maturities — 290 38,521 38,811 — 283 24,034 24,317
Purchases (463) (1,667) (93,155) (95,285) (3,514) (1,258) (100,569) (105,341)
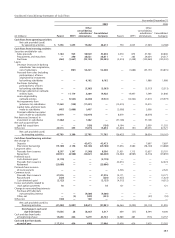
Loans:
Decrease (increase) in banking
subsidiaries’ loan originations,
net of collections — (981) 53,221 52,240 — (1,684) (53,131) (54,815)
Proceeds from sales (including
participations) of loans
originated for investment
by banking subsidiaries — — 6,162 6,162 — — 1,988 1,988
Purchases (including
participations) of loans
by banking subsidiaries — — (3,363) (3,363) — — (5,513) (5,513)
Principal collected on nonbank
entities’ loans — 11,119 3,309 14,428 — 14,447 7,399 21,846
Loans originated by
nonbank entities — (5,523) (4,438) (9,961) — (12,362) (7,611) (19,973)
Net repayments from
(advances to) subsidiaries 11,369 (138) (11,231) — (12,415) — 12,415 —
Capital notes and term loans
made to subsidiaries (497) (1,000) 1,497 — (2,008) — 2,008 —
Principal collected on notes/
loans made to subsidiaries 12,979 — (12,979) — 8,679 — (8,679) —
Net decrease (increase) in
investment in subsidiaries (1,382) — 1,382 — (37,108) — 37,108 —
Net cash acquired from
(paid for) acquisitions — — (138) (138) 9,194 — 2,009 11,203
Other, net 22,513 355 (7,015) 15,853 (21,823) (91) 69,235 47,321
Net cash provided (used)
by investing activities 45,703 3,380 22,702 71,785 (56,425) 210 38,054 (18,161)
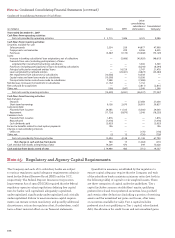
Cash flows from financing activities:
Net change in:
Deposits — — 42,473 42,473 — — 7,697 7,697
Short-term borrowings (19,100) 2,158 (52,166) (69,108) 17,636 5,580 (38,104) (14,888)
Long-term debt:
Proceeds from issuance 8,297 1,347 (1,248) 8,396 21,931 1,113 12,657 35,701
Repayment (22,931) (8,508) (34,821) (66,260) (16,560) (8,983) (4,316) (29,859)
Preferred stock:
Cash dividends paid (2,178) — — (2,178) ————
Proceeds from issuance ————22,674 — — 22,674
Redeemed (25,000) — — (25,000) ————
Proceeds from issuance
of stock warrants ————2,326 — — 2,326
Common stock:
Proceeds from issuance 21,976 — — 21,976 14,171 — — 14,171
Repurchased (220) — — (220) (1,623) — — (1,623)
Cash dividends paid (2,125) — — (2,125) (4,312) — — (4,312)
Excess tax benefits related to
stock option payments 18 — — 18 121 — — 121
Change in noncontrolling interests:
Purchase of Prudential’s
noncontrolling interest — — (4,500) (4,500) ————
Other, net — (4) (549) (553) — — (53) (53)
Other, net (140) — 140 — ————
Net cash provided (used) by
financing activities (41,403) (5,007) (50,671) (97,081) 56,364 (2,290) (22,119) 31,955
Net change in cash and
due from banks 11,656 28 (8,367) 3,317 669 (57) 8,394 9,006
Cash and due from banks
at beginning of year 15,658 426 7,679 23,763 14,989 483 (715) 14,757
Cash and due from banks
at end of year $ 27,314 454 (688) 27,080 15,658 426 7,679 23,763