Wells Fargo 2009 Annual Report Download - page 186
Download and view the complete annual report
Please find page 186 of the 2009 Wells Fargo annual report below. You can navigate through the pages in the report by either clicking on the pages listed below, or by using the keyword search tool below to find specific information within the annual report.-
 1
1 -
2
-
3
-
4
-
5
-
6
-
7
-
8
-
9
-
10
-
11
-
12
-
13
-
14
-
15
-
16
-
17
-
18
-
19
-
20
-
21
-
22
-
23
-
24
-
25
-
26
-
27
-
28
-
29
-
30
-
31
-
32
-
33
-
34
-
35
-
36
-
37
-
38
-
39
-
40
-
41
-
42
-
43
-
44
-
45
-
46
-
47
-
48
-
49
-
50
-
51
-
52
-
53
-
54
-
55
-
56
-
57
-
58
-
59
-
60
-
61
-
62
-
63
-
64
-
65
-
66
-
67
-
68
-
69
-
70
-
71
-
72
-
73
-
74
-
75
-
76
-
77
-
78
-
79
-
80
-
81
-
82
-
83
-
84
-
85
-
86
-
87
-
88
-
89
-
90
-
91
-
92
-
93
-
94
-
95
-
96
-
97
-
98
-
99
-
100
-
101
-
102
-
103
-
104
-
105
-
106
-
107
-
108
-
109
-
110
-
111
-
112
-
113
-
114
-
115
-
116
-
117
-
118
-
119
-
120
-
121
-
122
-
123
-
124
-
125
-
126
-
127
-
128
-
129
-
130
-
131
-
132
-
133
-
134
-
135
-
136
-
137
-
138
-
139
-
140
-
141
-
142
-
143
-
144
-
145
-
146
-
147
-
148
-
149
-
150
-
151
-
152
-
153
-
154
-
155
-
156
-
157
-
158
-
159
-
160
-
161
-
162
-
163
-
164
-
165
-
166
-
167
-
168
-
169
-
170
-
171
-
172
-
173
-
174
-
175
-
 176
176 -
 177
177 -
 178
178 -
 179
179 -
 180
180 -
 181
181 -
 182
182 -
 183
183 -
 184
184 -
 185
185 -
 186
186 -
 187
187 -
 188
188 -
 189
189 -
 190
190 -
 191
191 -
 192
192 -
 193
193 -
 194
194 -
 195
195 -
 196
196
 |
 |

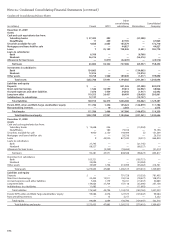
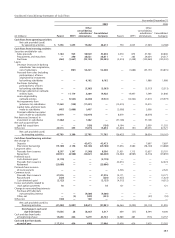
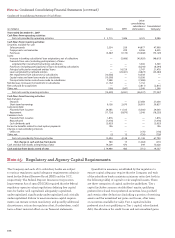
Condensed Consolidating Statement of Cash Flows
Other
consolidating
subsidiaries/ Consolidated
(in millions) Parent WFFI eliminations Company
Year ended December 31, 2007
Cash flows from operating activities:
Net cash provided by operating activities $ 3,715 1,446 4,125 9,286
Cash flows from investing activities:
Securities available for sale:
Sales proceeds 2,554 559 44,877 47,990
Prepayments and maturities — 299 8,206 8,505
Purchases (3,487) (1,174) (70,468) (75,129)
Loans:
Increase in banking subsidiaries’ loan originations, net of collections — (2,686) (45,929) (48,615)
Proceeds from sales (including participations) of loans
originated for investment by banking subsidiaries — — 3,369 3,369
Purchases (including participations) of loans by banking subsidiaries — — (8,244) (8,244)
Principal collected on nonbank entities’ loans — 18,729 2,747 21,476
Loans originated by nonbank entities — (20,461) (4,823) (25,284)
Net repayments from (advances to) subsidiaries (10,338) — 10,338 —
Capital notes and term loans made to subsidiaries (10,508) — 10,508 —
Principal collected on notes/loans made to subsidiaries 7,588 — (7,588) —
Net decrease (increase) in investment in subsidiaries (1,132) — 1,132 —
Net cash paid for acquisitions — — (2,811) (2,811)
Other, net (106) (847) 2,349 1,396
Net cash used by investing activities (15,429) (5,581) (56,337) (77,347)
Cash flows from financing activities:
Net change in:
Deposits — — 27,058 27,058
Short-term borrowings 9,138 2,670 28,019 39,827
Long-term debt:
Proceeds from issuance 24,385 11,335 (6,360) 29,360
Repayment (11,726) (9,870) 3,346 (18,250)
Common stock:
Proceeds from issuance 1,876 — — 1,876
Repurchased (7,418) — — (7,418)
Cash dividends paid (3,955) — — (3,955)
Excess tax benefits related to stock option payments 196 — — 196
Change in noncontrolling interests:
Other, net — — (176) (176)
Other, net (2) 13 (739) (728)
Net cash provided by financing activities 12,494 4,148 51,148 67,790
Net change in cash and due from banks 780 13 (1,064) (271)
Cash and due from banks at beginning of year 14,209 470 349 15,028
Cash and due from banks at end of year $ 14,989 483 (715) 14,757
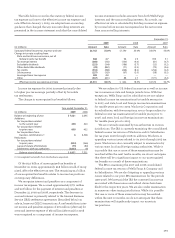
Note 25: Regulatory and Agency Capital Requirements
The Company and each of its subsidiary banks are subject
to various regulatory capital adequacy requirements adminis-
tered by the Federal Reserve Board (FRB) and the OCC,
respectively. The Federal Deposit Insurance Corporation
Improvement Act of 1991 (FDICIA) required that the federal
regulatory agencies adopt regulations defining five capital
tiers for banks: well capitalized, adequately capitalized,
undercapitalized, significantly undercapitalized and critically
undercapitalized. Failure to meet minimum capital require-
ments can initiate certain mandatory, and possibly additional
discretionary, actions by regulators that, if undertaken, could
have a direct material effect on our financial statements.
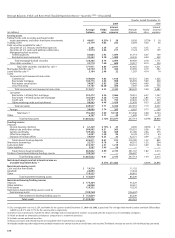
Quantitative measures, established by the regulators to
ensure capital adequacy, require that the Company and each
of the subsidiary banks maintain minimum ratios (set forth in
the following table) of capital to risk-weighted assets. There
are three categories of capital under the guidelines. Tier 1
capital includes common stockholders’ equity, qualifying
preferred stock and trust preferred securities, less goodwill
and certain other deductions (including a portion of servicing
assets and the unrealized net gains and losses, after taxes,
on securities available for sale). Tier 2 capital includes
preferred stock not qualifying as Tier 1 capital, subordinated
debt, the allowance for credit losses and net unrealized gains
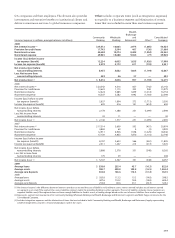
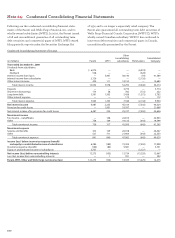
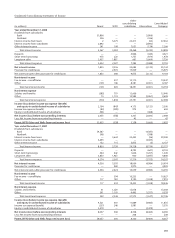
Note 24: Condensed Consolidating Financial Statements (continued)