Wells Fargo 2009 Annual Report Download - page 41
Download and view the complete annual report
Please find page 41 of the 2009 Wells Fargo annual report below. You can navigate through the pages in the report by either clicking on the pages listed below, or by using the keyword search tool below to find specific information within the annual report.-
 1
1 -
2
-
3
-
4
-
5
-
6
-
7
-
8
-
9
-
10
-
11
-
12
-
13
-
14
-
15
-
16
-
17
-
18
-
19
-
20
-
21
-
22
-
23
-
24
-
25
-
26
-
27
-
28
-
29
-
30
-
 31
31 -
 32
32 -
 33
33 -
 34
34 -
 35
35 -
 36
36 -
 37
37 -
 38
38 -
 39
39 -
 40
40 -
 41
41 -
 42
42 -
 43
43 -
 44
44 -
 45
45 -
 46
46 -
 47
47 -
 48
48 -
 49
49 -
 50
50 -
 51
51 -
52
-
53
-
54
-
55
-
56
-
57
-
58
-
59
-
60
-
61
-
62
-
63
-
64
-
65
-
66
-
67
-
68
-
69
-
70
-
71
-
72
-
73
-
74
-
75
-
76
-
77
-
78
-
79
-
80
-
81
-
82
-
83
-
84
-
85
-
86
-
87
-
88
-
89
-
90
-
91
-
92
-
93
-
94
-
95
-
96
-
97
-
98
-
99
-
100
-
101
-
102
-
103
-
104
-
105
-
106
-
107
-
108
-
109
-
110
-
111
-
112
-
113
-
114
-
115
-
116
-
117
-
118
-
119
-
120
-
121
-
122
-
123
-
124
-
125
-
126
-
127
-
128
-
129
-
130
-
131
-
132
-
133
-
134
-
135
-
136
-
137
-
138
-
139
-
140
-
141
-
142
-
143
-
144
-
145
-
146
-
147
-
148
-
149
-
150
-
151
-
152
-
153
-
154
-
155
-
156
-
157
-
158
-
159
-
160
-
161
-
162
-
163
-
164
-
165
-
166
-
167
-
168
-
169
-
170
-
171
-
172
-
173
-
174
-
175
-
176
-
177
-
178
-
179
-
180
-
181
-
182
-
183
-
184
-
185
-
186
-
187
-
188
-
189
-
190
-
191
-
192
-
193
-
194
-
195
-
196
 |
 |

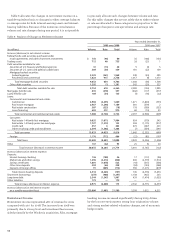
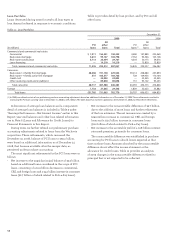
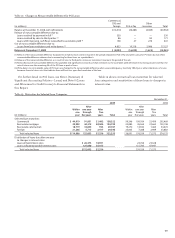
Table 4: Average Earning Assets and Funding Sources as a Percentage of Average Earning Assets
Year ended December 31,
2009 2008
% of % of
Average earning Average earning
(in millions) balance assets balance assets
Earning assets
Federal funds sold, securities purchased under
resale agreements and other short-term investments $ 26,869 2% $ 5,293 1%
Trading assets 21,092 2 4,971 1
Debt securities available for sale:
Securities of U.S. Treasury and federal agencies 2,480 — 1,083 —
Securities of U.S. states and political subdivisions 12,702 1 6,918 1
Mortgage-backed securities:
Federal agencies 87,197 8 44,777 9
Residential and commercial 41,618 4 20,749 4
Total mortgage-backed securities 128,815 12 65,526 13
Other debt securities (1) 32,011 3 12,818 2
Total debt securities available for sale (1) 176,008 16 86,345 16
Mortgages held for sale (2) 37,416 3 25,656 5
Loans held for sale (2) 6,293 1 837 —
Loans:
Commercial and commercial real estate:
Commercial 180,924 16 98,620 19
Real estate mortgage 104,197 10 41,659 8
Real estate construction 32,961 3 19,453 4
Lease financing 14,751 1 7,141 1
Total commercial and commercial real estate 332,833 30 166,873 32
Consumer:
Real estate 1-4 family first mortgage 238,359 22 75,116 14
Real estate 1-4 family junior lien mortgage 106,957 10 75,375 14
Credit card 23,357 2 19,601 4
Other revolving credit and installment 90,666 8 54,368 10
Total consumer 459,339 42 224,460 43
Foreign 30,661 3 7,127 1
Total loans (2) 822,833 75 398,460 76
Other 6,113 1 1,920 —
Total earning assets $1,096,624 100% $523,482 100%
Funding sources
Deposits:
Interest-bearing checking $ 70,179 6% $ 5,650 1%
Market rate and other savings 351,892 32 166,691 32
Savings certificates 140,197 13 39,481 8
Other time deposits 20,459 2 6,656 1
Deposits in foreign offices 53,166 5 47,578 9
Total interest-bearing deposits 635,893 58 266,056 51
Short-term borrowings 51,972 5 65,826 13
Long-term debt 231,801 21 102,283 20
Other liabilities 4,904 — — —
Total interest-bearing liabilities 924,570 84 434,165 83
Portion of noninterest-bearing funding sources 172,054 16 89,317 17
Total funding sources $1,096,624 100% $523,482 100%
Noninterest-earning assets
Cash and due from banks $ 19,218 11,175
Goodwill 23,997 13,353
Other 122,515 56,386
Total noninterest-earning assets $ 165,730 80,914
Noninterest-bearing funding sources
Deposits $ 171,712 87,820
Other liabilities 48,193 28,658
Total equity 117,879 53,753
Noninterest-bearing funding sources
used to fund earning assets (172,054) (89,317)
Net noninterest-bearing funding sources $ 165,730 80,914
Total assets $1,262,354 604,396
(1) Includes certain preferred securities.
(2) Nonaccrual loans are included in their respective loan categories.