Wells Fargo 2009 Annual Report Download - page 167
Download and view the complete annual report
Please find page 167 of the 2009 Wells Fargo annual report below. You can navigate through the pages in the report by either clicking on the pages listed below, or by using the keyword search tool below to find specific information within the annual report.-
 1
1 -
2
-
3
-
4
-
5
-
6
-
7
-
8
-
9
-
10
-
11
-
12
-
13
-
14
-
15
-
16
-
17
-
18
-
19
-
20
-
21
-
22
-
23
-
24
-
25
-
26
-
27
-
28
-
29
-
30
-
31
-
32
-
33
-
34
-
35
-
36
-
37
-
38
-
39
-
40
-
41
-
42
-
43
-
44
-
45
-
46
-
47
-
48
-
49
-
50
-
51
-
52
-
53
-
54
-
55
-
56
-
57
-
58
-
59
-
60
-
61
-
62
-
63
-
64
-
65
-
66
-
67
-
68
-
69
-
70
-
71
-
72
-
73
-
74
-
75
-
76
-
77
-
78
-
79
-
80
-
81
-
82
-
83
-
84
-
85
-
86
-
87
-
88
-
89
-
90
-
91
-
92
-
93
-
94
-
95
-
96
-
97
-
98
-
99
-
100
-
101
-
102
-
103
-
104
-
105
-
106
-
107
-
108
-
109
-
110
-
111
-
112
-
113
-
114
-
115
-
116
-
117
-
118
-
119
-
120
-
121
-
122
-
123
-
124
-
125
-
126
-
127
-
128
-
129
-
130
-
131
-
132
-
133
-
134
-
135
-
136
-
137
-
138
-
139
-
140
-
141
-
142
-
143
-
144
-
145
-
146
-
147
-
148
-
149
-
150
-
151
-
152
-
153
-
154
-
155
-
156
-
 157
157 -
 158
158 -
 159
159 -
 160
160 -
 161
161 -
 162
162 -
 163
163 -
 164
164 -
 165
165 -
 166
166 -
 167
167 -
 168
168 -
 169
169 -
 170
170 -
 171
171 -
 172
172 -
 173
173 -
 174
174 -
 175
175 -
 176
176 -
 177
177 -
178
-
179
-
180
-
181
-
182
-
183
-
184
-
185
-
186
-
187
-
188
-
189
-
190
-
191
-
192
-
193
-
194
-
195
-
196
 |
 |

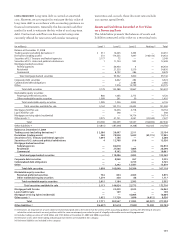
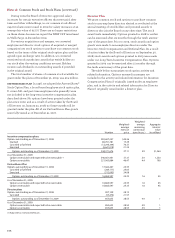
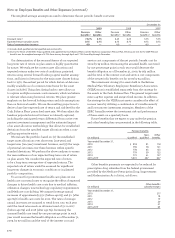
As of December 31, 2009, there was $186 million of
unrecognized compensation cost related to stock options.
That cost is expected to be recognized over a weighted-
average period of 1.9 years. The total intrinsic value of
options exercised during 2009 and 2008 was $50 million
and $348 million, respectively.
Cash received from the exercise of options for 2009 and
2008 was $153 million and $747 million, respectively. The
actual tax benefit recognized in stockholders’ equity for
the tax deductions from the exercise of options totaled
$18 million and $123 million, respectively, for 2009 and 2008.
We do not have a specific policy on repurchasing shares
to satisfy share option exercises. Rather, we have a general
policy on repurchasing shares to meet common stock
issuance requirements for our benefit plans (including share
option exercises), conversion of our convertible securities,
acquisitions and other corporate purposes. Various factors
determine the amount and timing of our share repurchases,
including our capital requirements, the number of shares we
expect to issue for acquisitions and employee benefit plans,
market conditions (including the trading price of our stock),
and regulatory and legal considerations. These factors can
change at any time, and there can be no assurance as to
the number of shares we will repurchase or when we will
repurchase them.
The fair value of each option award granted on or after
January 1, 2006, is estimated using a Black-Scholes valuation
model. The expected term of options granted is generally
based on the historical exercise behavior of full-term options.
Our expected volatilities are based on a combination of the
historical volatility of our common stock and implied volatili-
ties for traded options on our common stock. The risk-free
rate is based on the U.S. Treasury zero-coupon yield curve
in effect at the time of grant. Both expected volatility and
the risk-free rates are based on a period commensurate with
our expected term. For 2009, the expected dividend is based
on a fixed dividend amount. For 2008 and 2007, the expected
dividend was based on the current dividend, consideration
of our historical pattern of dividend increases and the market
price of our stock. We changed our method of estimating
the expected dividend assumption from a yield approach
to a fixed amount due to our participation in the TARP CPP
during 2009, which restricted us from increasing our dividend
without approval from the U.S. Treasury. A dividend yield
approach models a constant dividend yield, which was consid-
ered inappropriate given the restriction on our ability to
increase dividends.
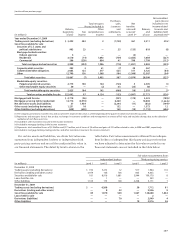
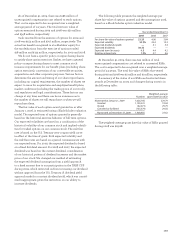
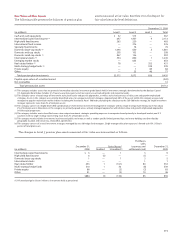
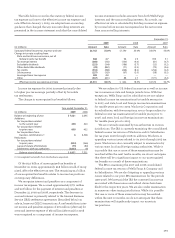
The following table presents the weighted-average per
share fair value of options granted and the assumptions used,
based on a Black-Scholes option valuation model.
Year ended December 31,
2009 2008 2007
Per share fair value of options granted $3.29 4.06 3.84
Expected volatility 53.9% 22.4 13.3
Expected dividends (yield) —4.1 3.4
Expected dividends $0.33 ——
Expected term (in years) 4.5 4.4 4.2
Risk-free interest rate 1.8% 2.7 4.6
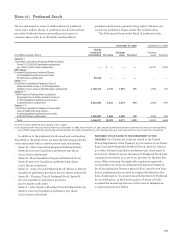
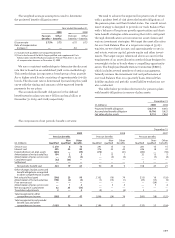
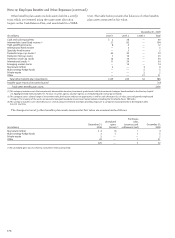
Weighted-average
Number grant-date fair value
Nonvested at January 1, 2009 1,026,166 $29.79
Granted 1,100,241 19.04
Vested (62,073) 29.79
Canceled or forfeited (155,379) 29.56
Nonvested at December 31, 2009 1,908,955 23.62
At December 31, 2009, there was $22 million of total
unrecognized compensation cost related to nonvested RSRs.
The cost is expected to be recognized over a weighted-average
period of 3.3 years. The total fair value of RSRs that vested
during 2009 and 2008 was $2 million and $1 million, respectively.
A summary of the status of our RSRs and restricted share
awards at December 31, 2009, and changes during 2009 is in
the following table:
The weighted-average grant date fair value of RSRs granted
during 2008 was $29.68.