Wells Fargo 2009 Annual Report Download - page 60
Download and view the complete annual report
Please find page 60 of the 2009 Wells Fargo annual report below. You can navigate through the pages in the report by either clicking on the pages listed below, or by using the keyword search tool below to find specific information within the annual report.-
 1
1 -
2
-
3
-
4
-
5
-
6
-
7
-
8
-
9
-
10
-
11
-
12
-
13
-
14
-
15
-
16
-
17
-
18
-
19
-
20
-
21
-
22
-
23
-
24
-
25
-
26
-
27
-
28
-
29
-
30
-
31
-
32
-
33
-
34
-
35
-
36
-
37
-
38
-
39
-
40
-
41
-
42
-
43
-
44
-
45
-
46
-
47
-
48
-
49
-
 50
50 -
 51
51 -
 52
52 -
 53
53 -
 54
54 -
 55
55 -
 56
56 -
 57
57 -
 58
58 -
 59
59 -
 60
60 -
 61
61 -
 62
62 -
 63
63 -
 64
64 -
 65
65 -
 66
66 -
 67
67 -
 68
68 -
 69
69 -
 70
70 -
71
-
72
-
73
-
74
-
75
-
76
-
77
-
78
-
79
-
80
-
81
-
82
-
83
-
84
-
85
-
86
-
87
-
88
-
89
-
90
-
91
-
92
-
93
-
94
-
95
-
96
-
97
-
98
-
99
-
100
-
101
-
102
-
103
-
104
-
105
-
106
-
107
-
108
-
109
-
110
-
111
-
112
-
113
-
114
-
115
-
116
-
117
-
118
-
119
-
120
-
121
-
122
-
123
-
124
-
125
-
126
-
127
-
128
-
129
-
130
-
131
-
132
-
133
-
134
-
135
-
136
-
137
-
138
-
139
-
140
-
141
-
142
-
143
-
144
-
145
-
146
-
147
-
148
-
149
-
150
-
151
-
152
-
153
-
154
-
155
-
156
-
157
-
158
-
159
-
160
-
161
-
162
-
163
-
164
-
165
-
166
-
167
-
168
-
169
-
170
-
171
-
172
-
173
-
174
-
175
-
176
-
177
-
178
-
179
-
180
-
181
-
182
-
183
-
184
-
185
-
186
-
187
-
188
-
189
-
190
-
191
-
192
-
193
-
194
-
195
-
196
 |
 |

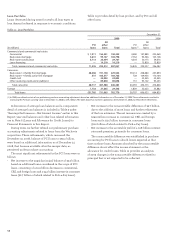
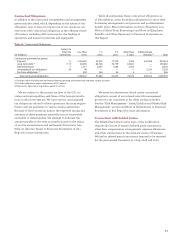
The minimum monthly payment for substantially all of our
Pick-a-Pay loans is reset annually. The new minimum monthly
payment amount usually cannot increase by more than 7.5% of
the then-existing principal and interest payment amount. The
minimum payment may not be sufficient to pay the monthly
interest due and in those situations a loan on which the cus-
tomer has made a minimum payment is subject to “negative
amortization,” where unpaid interest is added to the principal
balance of the loan. The amount of interest that has been
added to a loan balance is referred to as “deferred interest.”
Total deferred interest of $3.7 billion at December 31, 2009,
was down from $4.3 billion at December 31, 2008, due to loan
modification efforts as well as falling interest rates resulting
in the minimum payment option covering the interest and
some principal on many loans. At December 31, 2009,
approximately 47% of customers choosing the minimum
payment option did not defer interest.
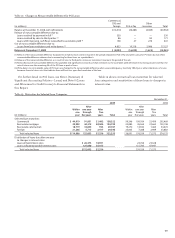
Deferral of interest on a Pick-a-Pay loan may continue
as long as the loan balance remains below a pre-defined
principal cap, which is based on the percentage that the
current loan balance represents to the original loan balance.
Loans with an original loan-to-value (LTV) ratio equal to or
below 85% have a cap of 125% of the original loan balance, and
these loans represent substantially all the Pick-a-Pay portfolio.
Loans with an original LTV ratio above 85% have a cap of
110% of the original loan balance. Most of the Pick-a-Pay loans
on which there is a deferred interest balance re-amortize (the
monthly payment amount is reset or “recast”) on the earlier
of the date when the loan balance reaches its principal cap,
or the 10-year anniversary of the loan. There exists a small
population of Pick-a-Pay loans for which recast occurs at the
five-year anniversary. After a recast, the customers’ new payment
terms are reset to the amount necessary to repay the balance
over the remainder of the original loan term.
Due to the terms of the Pick-a-Pay portfolio, there is little
recast risk over the next three years. Based on assumptions
of a flat rate environment, if all eligible customers elect the
minimum payment option 100% of the time and no balances
prepay, we would expect the following balances of loans to
recast based on reaching the principal cap: $2 million in 2010,
$1 million in 2011 and $4 million in 2012. In 2009, the amount of
loans recast based on reaching the principal cap was $1 million.
In addition, we would expect the following balances of loans to
start fully amortizing due to reaching their recast anniversary
date and also having a payment change at the recast date
greater than the annual 7.5% reset: $44 million in 2010, $52 million
in 2011 and $58 million in 2012. In 2009, the amount of loans
reaching their recast anniversary date and also having a
payment change over the annual 7.5% reset was $25 million.
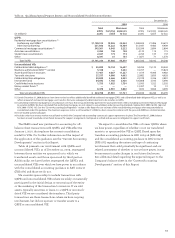
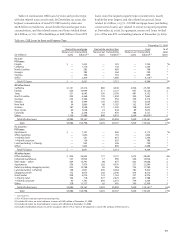
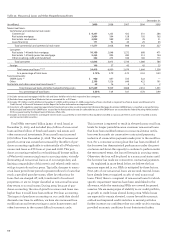
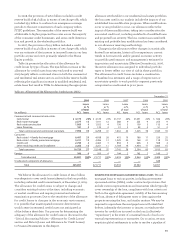
Table 24 reflects the geographic distribution of the
Pick-a-Pay portfolio broken out between PCI loans and all
other loans. In stressed housing markets with declining home
prices and increasing delinquencies, the LTV ratio is a useful
metric in predicting future real estate 1-4 family first mortgage
loan performance, including potential charge-offs. Because
PCI loans were initially recorded at fair value written down
for expected credit losses, the ratio of the carrying value to
the current collateral value for acquired loans with credit
impairment will be lower as compared with the LTV based
on the unpaid principal. For informational purposes, we have
included both ratios in the following table.
Table 24: Pick-a-Pay Portfolio
December 31, 2009
PCI loans All other loans
Ratio of
carrying
Unpaid Current value to Unpaid Current
principal LTV Carrying current principal LTV Carrying
(in millions) balance ratio(1) value(2) value balance ratio(1) value (2)
California $37,341 141% $25,022 94% $23,795 93% $23,626
Florida 5,751 139 3,199 77 5,046 104 4,942
New Jersey 1,646 101 1,269 77 2,914 82 2,912
Texas 442 82 399 74 1,967 66 1,973
Arizona 1,410 143 712 72 1,124 101 1,106
Other states 8,506 110 6,428 82 13,716 86 13,650
Total Pick-a-Pay loans $55,096 $37,029 $48,562 $48,209
(1) The current LTV ratio is calculated as the unpaid principal balance plus the unpaid principal balance of any equity lines of credit that share common collateral divided by
the collateral value. Collateral values are determined using AVMs and are updated quarterly. AVMs are computer-based tools used to estimate market values of homes
based on processing large volumes of market data including market comparables and price trends for local market areas.
(2) Carrying value, which does not reflect the allowance for loan losses, includes purchase accounting adjustments, which, for PCI loans, are the nonaccretable difference and
the accretable yield, and for all other loans, an adjustment to mark the loans to a market yield at date of merger less any subsequent charge-offs.