SunTrust 2009 Annual Report Download - page 99
Download and view the complete annual report
Please find page 99 of the 2009 SunTrust annual report below. You can navigate through the pages in the report by either clicking on the pages listed below, or by using the keyword search tool below to find specific information within the annual report.-
 1
1 -
2
-
3
-
4
-
5
-
6
-
7
-
8
-
9
-
10
-
11
-
12
-
13
-
14
-
15
-
16
-
17
-
18
-
19
-
20
-
21
-
22
-
23
-
24
-
25
-
26
-
27
-
28
-
29
-
30
-
31
-
32
-
33
-
34
-
35
-
36
-
37
-
38
-
39
-
40
-
41
-
42
-
43
-
44
-
45
-
46
-
47
-
48
-
49
-
50
-
51
-
52
-
53
-
54
-
55
-
56
-
57
-
58
-
59
-
60
-
61
-
62
-
63
-
64
-
65
-
66
-
67
-
68
-
69
-
70
-
71
-
72
-
73
-
74
-
75
-
76
-
77
-
78
-
79
-
80
-
81
-
82
-
83
-
84
-
85
-
86
-
87
-
88
-
 89
89 -
 90
90 -
 91
91 -
 92
92 -
 93
93 -
 94
94 -
 95
95 -
 96
96 -
 97
97 -
 98
98 -
 99
99 -
 100
100 -
 101
101 -
 102
102 -
 103
103 -
 104
104 -
 105
105 -
 106
106 -
 107
107 -
 108
108 -
 109
109 -
110
-
111
-
112
-
113
-
114
-
115
-
116
-
117
-
118
-
119
-
120
-
121
-
122
-
123
-
124
-
125
-
126
-
127
-
128
-
129
-
130
-
131
-
132
-
133
-
134
-
135
-
136
-
137
-
138
-
139
-
140
-
141
-
142
-
143
-
144
-
145
-
146
-
147
-
148
-
149
-
150
-
151
-
152
-
153
-
154
-
155
-
156
-
157
-
158
-
159
-
160
-
161
-
162
-
163
-
164
-
165
-
166
-
167
-
168
-
169
-
170
-
171
-
172
-
173
-
174
-
175
-
176
-
177
-
178
-
179
-
180
-
181
-
182
-
183
-
184
-
185
-
186
 |
 |

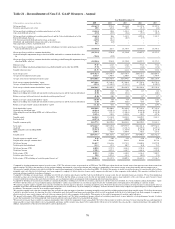
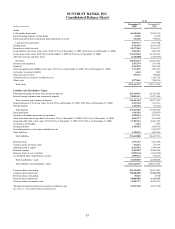
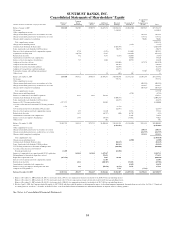
SUNTRUST BANKS, INC.
Consolidated Balance Sheets
As of
(Dollars in thousands)
December 31
2009
December 31
2008
Assets
Cash and due from banks $6,456,406 $5,622,789
Interest-bearing deposits in other banks 24,109 23,999
Funds sold and securities purchased under agreements to resell 516,656 990,614
Cash and cash equivalents 6,997,171 6,637,402
Trading assets 4,979,938 10,396,269
Securities available for sale128,477,042 19,696,537
Loans held for sale (loans at fair value: $2,923,375 as of December 31, 2009; $2,424,432 as of December 31, 2008) 4,669,823 4,032,128
Loans (loans at fair value: $448,720 as of December 31, 2009; $270,342 as of December 31, 2008) 113,674,844 126,998,443
Allowance for loan and lease losses (3,120,000) (2,350,996)
Net loans 110,554,844 124,647,447
Premises and equipment 1,551,794 1,547,892
Goodwill 6,319,078 7,043,503
Other intangible assets (MSRs at fair value: $935,561 as of December 31, 2009; $0 as of December 31, 2008) 1,711,299 1,035,427
Customers’ acceptance liability 6,264 5,294
Other real estate owned 619,621 500,481
Unsettled sales of securities available for sale -6,386,795
Other assets 8,277,861 7,208,786
Total assets $174,164,735 $189,137,961
Liabilities and Shareholders’ Equity
Noninterest-bearing consumer and commercial deposits $24,244,041 $21,522,021
Interest-bearing consumer and commercial deposits 92,059,411 83,753,686
Total consumer and commercial deposits 116,303,452 105,275,707
Brokered deposits (CDs at fair value: $1,260,505 as of December 31, 2009; $587,486 as of December 31, 2008) 4,231,530 7,667,167
Foreign deposits 1,328,584 385,510
Total deposits 121,863,566 113,328,384
Funds purchased 1,432,581 1,120,079
Securities sold under agreements to repurchase 1,870,510 3,193,311
Other short-term borrowings (debt at fair value: $0 as of December 31, 2009; $399,611 as of December 31, 2008) 2,062,277 5,166,360
Long-term debt (debt at fair value: $3,585,892 as of December 31, 2009; $7,155,684 as of December 31, 2008) 17,489,516 26,812,381
Acceptances outstanding 6,264 5,294
Trading liabilities 2,188,923 3,240,784
Unsettled purchases of securities available for sale -8,898,279
Other liabilities 4,720,243 4,872,284
Total liabilities 151,633,880 166,637,156
Preferred stock 4,917,312 5,221,703
Common stock, $1.00 par value 514,667 372,799
Additional paid in capital 8,521,042 6,904,644
Retained earnings 8,562,807 10,388,984
Treasury stock, at cost, and other (1,055,136) (1,368,450)
Accumulated other comprehensive income 1,070,163 981,125
Total shareholders’ equity 22,530,855 22,500,805
Total liabilities and shareholders’ equity $174,164,735 $189,137,961
Common shares outstanding 499,156,858 354,515,013
Common shares authorized 750,000,000 750,000,000
Preferred shares outstanding 50,225 53,500
Preferred shares authorized 50,000,000 50,000,000
Treasury shares of common stock 15,509,737 18,284,356
1Includes net unrealized gains on securities available for sale $1,831,948 $1,413,330
See Notes to Consolidated Financial Statements.
83