SunTrust 2009 Annual Report Download - page 34
Download and view the complete annual report
Please find page 34 of the 2009 SunTrust annual report below. You can navigate through the pages in the report by either clicking on the pages listed below, or by using the keyword search tool below to find specific information within the annual report.-
 1
1 -
2
-
3
-
4
-
5
-
6
-
7
-
8
-
9
-
10
-
11
-
12
-
13
-
14
-
15
-
16
-
17
-
18
-
19
-
20
-
21
-
22
-
23
-
 24
24 -
 25
25 -
 26
26 -
 27
27 -
 28
28 -
 29
29 -
 30
30 -
 31
31 -
 32
32 -
 33
33 -
 34
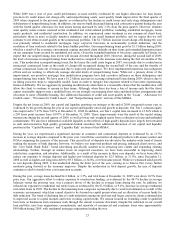
34 -
 35
35 -
 36
36 -
 37
37 -
 38
38 -
 39
39 -
 40
40 -
 41
41 -
 42
42 -
 43
43 -
 44
44 -
45
-
46
-
47
-
48
-
49
-
50
-
51
-
52
-
53
-
54
-
55
-
56
-
57
-
58
-
59
-
60
-
61
-
62
-
63
-
64
-
65
-
66
-
67
-
68
-
69
-
70
-
71
-
72
-
73
-
74
-
75
-
76
-
77
-
78
-
79
-
80
-
81
-
82
-
83
-
84
-
85
-
86
-
87
-
88
-
89
-
90
-
91
-
92
-
93
-
94
-
95
-
96
-
97
-
98
-
99
-
100
-
101
-
102
-
103
-
104
-
105
-
106
-
107
-
108
-
109
-
110
-
111
-
112
-
113
-
114
-
115
-
116
-
117
-
118
-
119
-
120
-
121
-
122
-
123
-
124
-
125
-
126
-
127
-
128
-
129
-
130
-
131
-
132
-
133
-
134
-
135
-
136
-
137
-
138
-
139
-
140
-
141
-
142
-
143
-
144
-
145
-
146
-
147
-
148
-
149
-
150
-
151
-
152
-
153
-
154
-
155
-
156
-
157
-
158
-
159
-
160
-
161
-
162
-
163
-
164
-
165
-
166
-
167
-
168
-
169
-
170
-
171
-
172
-
173
-
174
-
175
-
176
-
177
-
178
-
179
-
180
-
181
-
182
-
183
-
184
-
185
-
186
 |
 |
PART II
Item 5. MARKET FOR REGISTRANT’S COMMON EQUITY, RELATED STOCKHOLDER MATTERS AND
ISSUER PURCHASES OF EQUITY SECURITIES
The principal market in which the common stock of the Company is traded is the NYSE. See Item 6 and Table 18 in the
MD&A for information on the high and the low sales prices of the SunTrust Banks, Inc. common stock on the NYSE, which
is incorporated herein by reference. During the twelve months ended December 31, 2009 we paid a quarterly dividend on
common stock of $0.10 per common share for the first two quarters and $0.01 per common share for the third and fourth
quarter compared to a quarterly dividend on common stock of $0.77 per common share for the first three quarters and $0.54
per common share in the fourth quarter of 2008. Our common stock is held of record by approximately 37,016 holders as of
December 31, 2009. See Table 23 in the MD&A for information on the monthly share repurchases activity, including total
common shares repurchased and announced programs, weighted average per share price, and the remaining buy-back
authority under the announced programs, which is incorporated herein by reference.
Please also refer to Item 1, “Business - Government Supervision and Regulation” for a discussion of legal restrictions which
affect our ability to pay dividends; Item 1A, “Risk Factors,” for a discussion of some risks related to our dividend, and
Item 7, “Management’s Discussion and Analysis of Financial Condition and Results of Operation—Capital Resources,” for a
discussion of the dividends paid during the year and factors that may affect the future level of dividends.
The information under the caption “Equity Compensation Plans” in our definitive proxy statement to be filed with the SEC is
incorporated by reference into this Item 5.
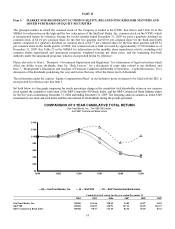
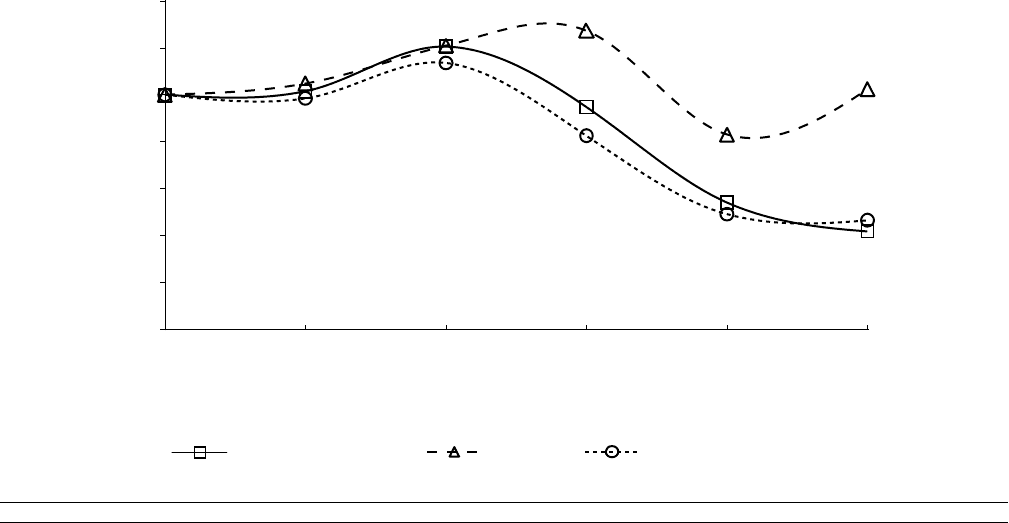
Set forth below is a line graph comparing the yearly percentage change in the cumulative total shareholder return on our common
stock against the cumulative total return of the S&P Composite-500 Stock Index, and the S&P Commercial Bank Industry Index
for the five years commencing December 31, 2004 and ending December 31, 2009. The foregoing analysis assumes an initial $100
investment in our stock and each index and the reinvestment of all dividends during the periods presented.
COMPARISON OF 5 YEAR CUMULATIVE TOTAL RETURN
SunTrust Banks, Inc., The S&P 500 Index,
and S&P Commercial Bank Index
SunTrust Banks, Inc. S&P 500 S&P Commercial Bank Index
12/04 12/05 12/06 12/07 12/08 12/09
$0
$20
$40
$60
$80
$100
$120
$140
Cumulative total return for the year ended December 31
2004 2005 2006 2007 2008 2009
SunTrust Banks, Inc. 100.00 101.46 120.59 94.82 54.07 41.85
S&P 500 100.00 104.83 120.91 127.33 83.05 102.37
S&P Commercial Bank Index 100.00 98.47 113.55 82.54 49.10 46.52
18