SunTrust 2009 Annual Report Download - page 45
Download and view the complete annual report
Please find page 45 of the 2009 SunTrust annual report below. You can navigate through the pages in the report by either clicking on the pages listed below, or by using the keyword search tool below to find specific information within the annual report.-
 1
1 -
2
-
3
-
4
-
5
-
6
-
7
-
8
-
9
-
10
-
11
-
12
-
13
-
14
-
15
-
16
-
17
-
18
-
19
-
20
-
21
-
22
-
23
-
24
-
25
-
26
-
27
-
28
-
29
-
30
-
31
-
32
-
33
-
34
-
 35
35 -
 36
36 -
 37
37 -
 38
38 -
 39
39 -
 40
40 -
 41
41 -
 42
42 -
 43
43 -
 44
44 -
 45
45 -
 46
46 -
 47
47 -
 48
48 -
 49
49 -
 50
50 -
 51
51 -
 52
52 -
 53
53 -
 54
54 -
 55
55 -
56
-
57
-
58
-
59
-
60
-
61
-
62
-
63
-
64
-
65
-
66
-
67
-
68
-
69
-
70
-
71
-
72
-
73
-
74
-
75
-
76
-
77
-
78
-
79
-
80
-
81
-
82
-
83
-
84
-
85
-
86
-
87
-
88
-
89
-
90
-
91
-
92
-
93
-
94
-
95
-
96
-
97
-
98
-
99
-
100
-
101
-
102
-
103
-
104
-
105
-
106
-
107
-
108
-
109
-
110
-
111
-
112
-
113
-
114
-
115
-
116
-
117
-
118
-
119
-
120
-
121
-
122
-
123
-
124
-
125
-
126
-
127
-
128
-
129
-
130
-
131
-
132
-
133
-
134
-
135
-
136
-
137
-
138
-
139
-
140
-
141
-
142
-
143
-
144
-
145
-
146
-
147
-
148
-
149
-
150
-
151
-
152
-
153
-
154
-
155
-
156
-
157
-
158
-
159
-
160
-
161
-
162
-
163
-
164
-
165
-
166
-
167
-
168
-
169
-
170
-
171
-
172
-
173
-
174
-
175
-
176
-
177
-
178
-
179
-
180
-
181
-
182
-
183
-
184
-
185
-
186
 |
 |
in more recent years gives us reason to believe that successful repurchase requests by investors and loss severities will
decline. The level of losses and reserves during 2010 are dependent primarily upon the continued shift in request volume to
newer vintages and no significant deterioration in the overall asset quality of the previously sold loans as indicated by
borrower payment performance.
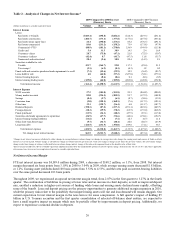
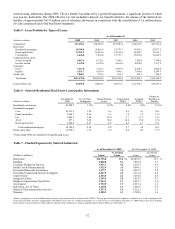
Net securities gains of $1.1 billion for 2008 included a $732.2 million gain on the sale and contribution of a portion of our
investment in Coke common stock in addition to a $413.1 million gain on the sale of MBS held in conjunction with our risk
management strategies associated with economically hedging the value of MSRs. These gains were partially offset by the
recognition through earnings of $83.8 million in charges related to certain ABS that were determined in 2008 to be other-
than-temporarily impaired. For additional information on transactions related to our holdings in Coke common stock, refer to
“Investment in Common Shares of The Coca-Cola Company” within this MD&A. During 2009, we recorded net securities
gains of $98.0 million which included a $90.2 million gain on the sale of approximately $9.2 billion of agency MBS. These
sales were associated with repositioning the MBS portfolio into securities we believe have higher relative value. Net
securities gains also included $20.0 million of credit-related OTTI losses on securities with a fair value of approximately
$310.6 million, consisting primarily of purchased and retained private residential MBS.
In May 2009, we sold 3.2 million of our Visa Class B shares and entered into a derivative related to such shares. We
recognized a gain of $112.1 million in connection with these transactions. During the first quarter of 2008, Visa completed
its IPO, and upon the closing, approximately 2 million of our Class B shares were mandatorily redeemed for $86.3 million,
which was recorded as a gain in noninterest income. See Note 18, “Reinsurance Arrangements and Guarantees,” to the
Consolidated Financial Statements for further discussion of the Visa transaction. Gain on sale of businesses consists of an
$89.4 million gain on the sale of our remaining interest in Lighthouse Investment Partners during the first quarter of 2008, an
$81.8 million gain on the sale of TransPlatinum, our fuel card and fleet management subsidiary, in the third quarter of 2008,
a $29.6 million gain on the sale of First Mercantile, a retirement plan services subsidiary, during the second quarter of 2008,
and a $2.7 million loss on the sale of a majority interest in ZCI during the fourth quarter of 2008.
Trust and investment management income decreased $105.8 million, or 17.9%, compared to 2008, primarily due to lower fee
income attributable to the decline in the equity markets, lower interest rates, and a decline in income associated with the sale
of First Mercantile on May 30, 2008. Retail investment services income decreased $71.3 million, or 24.7%, compared to
2008, due to lower annuity sales and reduced brokerage activity and client asset balances. Service charges on deposit
accounts decreased $55.7 million, or 6.2%, compared to 2008, as a result of a reduction in consumer spending and lower
non-sufficient fund fees. We expect to comply with regulatory changes made by the Federal Reserve and are monitoring
potential legislative proposals which, should they become effective, have the potential to affect our ability to generate certain
types of fee income in future periods.
Trading account profits/(losses) and commissions decreased $78.9 million compared to 2008, primarily due to $153.0 million
in mark to market losses on our public debt and related hedges carried at fair value during 2009 compared with gains of
$431.7 million in 2008. The losses during 2009 were caused by an improvement in our credit spreads. These losses were
partially offset by $255.9 million in market valuation losses recorded during 2008 on our investments in certain illiquid ABS
compared to small gains in 2009 as our exposure to these investments has been substantially reduced through sales,
maturities, and write-downs. Additionally, during 2008, we recorded a $177.7 million loss related to our expected repurchase
of certain ARS. Capital markets related trading income increased during 2009, compared to the same periods in 2008, due to
improved equity derivatives and bond trading offset by decreased fixed income derivative performance. Investment banking
income increased $35.5 million, or 15.0%, compared to 2008, due to improved bond origination fees, loan syndication fees,
equity underwriting, and direct financing revenues.
Other income decreased $76.2 million, or 31.8%, compared to 2008. The decline was primarily due to losses recognized on
certain private equity investments and leases in 2009 compared to gains in 2008 and a recovery from the resolution of a
litigation matter recognized in 2008.
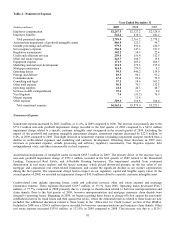
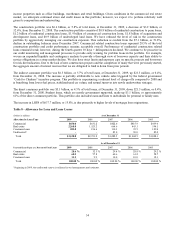
During 2008, we completed sale/leaseback transactions, consisting of 152 branch properties and various individual office
buildings. In total, we sold and concurrently leased back $201.9 million in land and buildings with associated accumulated
depreciation of $110.3 million. For the year ended December 31, 2008, we recognized $37.0 million of the gain immediately
while the remaining $160.3 million in gains were deferred and will be recognized ratably over the expected term of the
respective leases, predominantly as an offset to net occupancy expense.
29