SunTrust 2009 Annual Report Download - page 88
Download and view the complete annual report
Please find page 88 of the 2009 SunTrust annual report below. You can navigate through the pages in the report by either clicking on the pages listed below, or by using the keyword search tool below to find specific information within the annual report.-
 1
1 -
2
-
3
-
4
-
5
-
6
-
7
-
8
-
9
-
10
-
11
-
12
-
13
-
14
-
15
-
16
-
17
-
18
-
19
-
20
-
21
-
22
-
23
-
24
-
25
-
26
-
27
-
28
-
29
-
30
-
31
-
32
-
33
-
34
-
35
-
36
-
37
-
38
-
39
-
40
-
41
-
42
-
43
-
44
-
45
-
46
-
47
-
48
-
49
-
50
-
51
-
52
-
53
-
54
-
55
-
56
-
57
-
58
-
59
-
60
-
61
-
62
-
63
-
64
-
65
-
66
-
67
-
68
-
69
-
70
-
71
-
72
-
73
-
74
-
75
-
76
-
77
-
 78
78 -
 79
79 -
 80
80 -
 81
81 -
 82
82 -
 83
83 -
 84
84 -
 85
85 -
 86
86 -
 87
87 -
 88
88 -
 89
89 -
 90
90 -
 91
91 -
 92
92 -
 93
93 -
 94
94 -
 95
95 -
 96
96 -
 97
97 -
 98
98 -
99
-
100
-
101
-
102
-
103
-
104
-
105
-
106
-
107
-
108
-
109
-
110
-
111
-
112
-
113
-
114
-
115
-
116
-
117
-
118
-
119
-
120
-
121
-
122
-
123
-
124
-
125
-
126
-
127
-
128
-
129
-
130
-
131
-
132
-
133
-
134
-
135
-
136
-
137
-
138
-
139
-
140
-
141
-
142
-
143
-
144
-
145
-
146
-
147
-
148
-
149
-
150
-
151
-
152
-
153
-
154
-
155
-
156
-
157
-
158
-
159
-
160
-
161
-
162
-
163
-
164
-
165
-
166
-
167
-
168
-
169
-
170
-
171
-
172
-
173
-
174
-
175
-
176
-
177
-
178
-
179
-
180
-
181
-
182
-
183
-
184
-
185
-
186
 |
 |

Corporate Other and Treasury
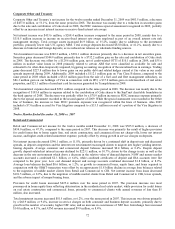
Corporate Other and Treasury’s net income for the twelve months ended December 31, 2009 was $403.5 million, a decrease
of $457.0 million, or 53.1%, from the same period in 2008. The decrease was mainly due to a reduction in securities gains
due to the sale and contribution of Coke stock in 2008, the FDIC insurance special assessment recognized in 2009, partially
offset by an increase in net interest income on receive-fixed interest rate swaps.
Net interest income was $433.6 million, a $268.4 million increase compared to the same period in 2008, mainly due to a
$310.5 million increase in income on receive-fixed interest rate swaps employed as part of an overall interest rate risk
management strategy. Total average assets increased $6.9 billion, or 35.2%, mainly due to additions to the investment
portfolio, primarily lower risk U.S. agency MBS. Total average deposits decreased $8.8 billion, or 61.2%, mainly due to a
decrease in brokered and foreign deposits, as we reduced our reliance on wholesale funding sources.
Total noninterest income was $202.2 million, a $901.1 million decrease primarily due to a decrease in net securities gains.
Securities gains decreased $544.9 million primarily due to a $732.2 million gain on the sale and contribution of Coke stock
in 2008. The decrease was offset by a $129.6 million gain, net of credit-related OTTI of $10.1 million in 2009, and $55.6
million in market value losses in 2008 primarily related to certain ABS that were classified as available for sale and
estimated to be other-than-temporarily impaired, triggering accounting recognition of the unrealized loss in earnings. Trading
gains decreased $227.8 million due to lower gains on our public debt and related hedges carried at fair value as our credit
spreads improved during 2009. Additionally, 2009 included a $112.1 million gain on Visa Class B shares, compared to the
same period in 2008 which included a $81.8 million gain from the sale of a fuel card and fleet management subsidiary, an
$86.3 million gain on our holdings of Visa in connection with its IPO, a $37.0 million gain on sale/leaseback of real estate
properties, and $21.1 million of merchant card fee income generated by Transplatinum in 2008.
Total noninterest expense decreased $28.1 million compared to the same period in 2008. The decrease was mainly due to the
recognition of $183.4 million in expense related to the contribution of Coke shares to the SunTrust charitable foundation in
the third quarter of 2008. The decrease was partially offset by a $78.9 million increase in FDIC insurance expense primarily
due to the special assessment recorded in the second quarter of 2009. While the special assessment was recorded in the Other
line of business, the increase in base FDIC premium expenses was recognized within the lines of business. Also 2009
included a $7.0 million accrual for Visa litigation compared to a $33.5 million reversal of a portion of the Visa litigation in
2008.
Twelve Months Ended December 31, 2008 vs. 2007
Retail and Commercial
Retail and Commercial net income for the twelve months ended December 31, 2008 was $505.0 million, a decrease of
$454.0 million, or 47.3%, compared to the same period in 2007. This decrease was primarily the result of higher provision
for credit losses due to home equity line, real estate construction, and commercial loan net charge-offs, lower net interest
income, and higher credit-related noninterest expense, partially offset by strong growth in service charges on deposits.
Net interest income decreased $346.1 million, or 11.8%, primarily driven by a continued shift in deposit mix and decreased
spreads, as deposit competition and the interest rate environment encouraged clients to migrate into higher yielding interest-
bearing deposits. Average consumer and commercial deposit balances increased $0.4 billion, or 0.6%. Despite deposit
growth, deposit-related net interest income declined by $223.1 million, or 10.7%, driven by the change in mix as well as the
decrease in the rate environment which drove a decrease in the relative value of demand deposits. NOW and money market
accounts increased a combined $2.3 billion, or 6.4%, while combined certificates of deposit and IRA accounts were flat
compared to the prior year. Low cost demand deposit and savings accounts combined decreased $1.8 billion, or 8.9%.
Average loan balances declined $0.6 billion, or 1.2%, as growth in commercial loans, equity lines, and loans acquired in
conjunction with the GB&T transaction were offset by an approximate $1.8 billion decline in average loan balances related
to the migration of middle market clients from Retail and Commercial to CIB. Net interest income from loans decreased
$101.5 million, or 8.9%, due to the migration of middle market clients from Retail and Commercial to CIB, lower spreads,
and the adverse impact of nonperforming loans.
Provision for credit losses increased $425.4 million over the same period in 2007. The provision increase was most
pronounced in home equity lines reflecting deterioration in the residential real estate market, while provision for credit losses
on real estate construction and commercial loans, primarily to commercial clients with annual revenues of less than $5
million, also increased.
Total noninterest income increased $81.5 million, or 6.2%, over the same period in 2007. This increase was driven primarily
by a $68.9 million, or 9.4%, increase in service charges on both consumer and business deposit accounts, primarily due to
growth in the number of accounts, higher NSF rates, and an increase in occurrences of NSF fees. Interchange fees increased
$14.0 million, or 8.1%, and ATM revenue increased $9.9 million, or 8.4%.
72