SunTrust 2009 Annual Report Download - page 147
Download and view the complete annual report
Please find page 147 of the 2009 SunTrust annual report below. You can navigate through the pages in the report by either clicking on the pages listed below, or by using the keyword search tool below to find specific information within the annual report.-
 1
1 -
2
-
3
-
4
-
5
-
6
-
7
-
8
-
9
-
10
-
11
-
12
-
13
-
14
-
15
-
16
-
17
-
18
-
19
-
20
-
21
-
22
-
23
-
24
-
25
-
26
-
27
-
28
-
29
-
30
-
31
-
32
-
33
-
34
-
35
-
36
-
37
-
38
-
39
-
40
-
41
-
42
-
43
-
44
-
45
-
46
-
47
-
48
-
49
-
50
-
51
-
52
-
53
-
54
-
55
-
56
-
57
-
58
-
59
-
60
-
61
-
62
-
63
-
64
-
65
-
66
-
67
-
68
-
69
-
70
-
71
-
72
-
73
-
74
-
75
-
76
-
77
-
78
-
79
-
80
-
81
-
82
-
83
-
84
-
85
-
86
-
87
-
88
-
89
-
90
-
91
-
92
-
93
-
94
-
95
-
96
-
97
-
98
-
99
-
100
-
101
-
102
-
103
-
104
-
105
-
106
-
107
-
108
-
109
-
110
-
111
-
112
-
113
-
114
-
115
-
116
-
117
-
118
-
119
-
120
-
121
-
122
-
123
-
124
-
125
-
126
-
127
-
128
-
129
-
130
-
131
-
132
-
133
-
134
-
135
-
136
-
 137
137 -
 138
138 -
 139
139 -
 140
140 -
 141
141 -
 142
142 -
 143
143 -
 144
144 -
 145
145 -
 146
146 -
 147
147 -
 148
148 -
 149
149 -
 150
150 -
 151
151 -
 152
152 -
 153
153 -
 154
154 -
 155
155 -
 156
156 -
 157
157 -
158
-
159
-
160
-
161
-
162
-
163
-
164
-
165
-
166
-
167
-
168
-
169
-
170
-
171
-
172
-
173
-
174
-
175
-
176
-
177
-
178
-
179
-
180
-
181
-
182
-
183
-
184
-
185
-
186
 |
 |

SUNTRUST BANKS, INC.
Notes to Consolidated Financial Statements (Continued)
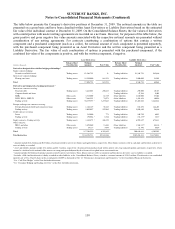
The Company’s derivative positions as of December 31, 2008 were as follows:
Contract or Notional Amount
(Dollars in millions) End User
For
Clients
Derivatives contracts
Interest rate contracts
Swaps $20,193 $126,913
Futures and forwards 10,089 40,057
Options 1,500 28,098
Total interest rate contracts 31,782 195,068
Interest rate lock commitments 7,161 -
Equity contracts 3,094 11,214
Foreign exchange contracts 2,009 5,659
Other derivative contracts 345 1,671
Total derivatives contracts $44,391 $213,612
Credit-related arrangements
Commitments to extend credit $79,191
Standby letters of credit and similar arrangements 13,942
Total credit-related arrangements $93,133
The impacts of derivative financial instruments on the Consolidated Statements of Income/(Loss) and the Consolidated
Statements of Shareholders’ Equity for the year ended December 31, 2009 is presented below. The impacts are segregated
between those derivatives that are designated in hedging relationships and those that are used for economic hedging or
trading purposes, with further identification of the underlying risks in the derivatives and the hedged items, where
appropriate. The tables do not disclose the financial impact of the activities that these derivative instruments are intended to
hedge, for both economic hedges and those instruments designated in formal, qualifying hedging relationships.
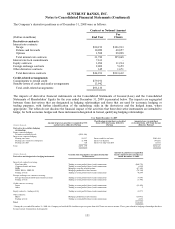
Year Ended December 31, 2009
(Dollars in thousands)
Amount of pre-tax gain/(loss) recognized in OCI
on Derivatives (Effective Portion)
Classification of gain/(loss) reclassified
from AOCI into Income (Effective
Portion)
Amount of pre-tax gain/(loss)
reclassified from AOCI into Income
(Effective Portion)1
Derivatives in cash flow hedging
relationships
Equity contracts hedging:
Securities available for sale ($295,982)
Interest rate contracts hedging:
Floating rate loans 99,317 Interest and fees on loans $503,424
Floating rate certificates of deposits (1,499) Interest on deposits (47,265)
Floating rate debt (15) Interest on long-term debt (1,333)
Total ($198,179) $454,826
(Dollars in thousands)
Derivatives not designated as hedging instruments
Classification of gain/(loss) recognized in Income
on Derivatives
Amount of gain/(loss) recognized in
Income on Derivatives for the year
ended December 31, 2009
Interest rate contracts covering:
Fixed rate debt Trading account profits/(losses) and commissions ($60,731)
Corporate bonds and loans Trading account profits/(losses) and commissions 6,530
MSRs Mortgage servicing related income (87,855)
LHFS, IRLCs, LHFI-FV Mortgage production related income (74,914)
Trading activity Trading account profits/(losses) and commissions 46,399
Foreign exchange rate contracts covering:
Foreign-denominated debt and commercial loans Trading account profits/(losses) and commissions 71,696
Trading activity Trading account profits/(losses) and commissions (3,991)
Credit contracts covering:
Loans Trading account profits/(losses) and commissions (19,493)
Other Trading account profits/(losses) and commissions 9
Equity contracts - trading activity Trading account profits/(losses) and commissions 22,571
Other contracts:
IRLCs Mortgage production related income 629,972
Trading activity Trading account profits/(losses) and commissions 2,636
Total $532,829
1During the year ended December 31, 2009, the Company reclassified $30.8 million in pre-tax gains from AOCI into net interest income. These gains related to hedging relationships that have
been previously terminated or de-designated.
131