SunTrust 2009 Annual Report Download - page 59
Download and view the complete annual report
Please find page 59 of the 2009 SunTrust annual report below. You can navigate through the pages in the report by either clicking on the pages listed below, or by using the keyword search tool below to find specific information within the annual report.-
 1
1 -
2
-
3
-
4
-
5
-
6
-
7
-
8
-
9
-
10
-
11
-
12
-
13
-
14
-
15
-
16
-
17
-
18
-
19
-
20
-
21
-
22
-
23
-
24
-
25
-
26
-
27
-
28
-
29
-
30
-
31
-
32
-
33
-
34
-
35
-
36
-
37
-
38
-
39
-
40
-
41
-
42
-
43
-
44
-
45
-
46
-
47
-
48
-
 49
49 -
 50
50 -
 51
51 -
 52
52 -
 53
53 -
 54
54 -
 55
55 -
 56
56 -
 57
57 -
 58
58 -
 59
59 -
 60
60 -
 61
61 -
 62
62 -
 63
63 -
 64
64 -
 65
65 -
 66
66 -
 67
67 -
 68
68 -
 69
69 -
70
-
71
-
72
-
73
-
74
-
75
-
76
-
77
-
78
-
79
-
80
-
81
-
82
-
83
-
84
-
85
-
86
-
87
-
88
-
89
-
90
-
91
-
92
-
93
-
94
-
95
-
96
-
97
-
98
-
99
-
100
-
101
-
102
-
103
-
104
-
105
-
106
-
107
-
108
-
109
-
110
-
111
-
112
-
113
-
114
-
115
-
116
-
117
-
118
-
119
-
120
-
121
-
122
-
123
-
124
-
125
-
126
-
127
-
128
-
129
-
130
-
131
-
132
-
133
-
134
-
135
-
136
-
137
-
138
-
139
-
140
-
141
-
142
-
143
-
144
-
145
-
146
-
147
-
148
-
149
-
150
-
151
-
152
-
153
-
154
-
155
-
156
-
157
-
158
-
159
-
160
-
161
-
162
-
163
-
164
-
165
-
166
-
167
-
168
-
169
-
170
-
171
-
172
-
173
-
174
-
175
-
176
-
177
-
178
-
179
-
180
-
181
-
182
-
183
-
184
-
185
-
186
 |
 |
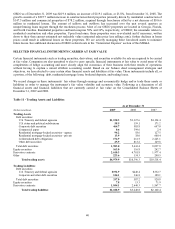
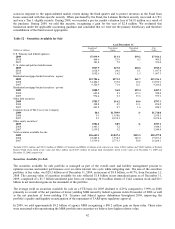
The portfolio’s effective duration increased to 3.0% as of December 31, 2009 from 2.8% as of December 31, 2008. Effective
duration is a measure of price sensitivity of a bond portfolio to an immediate change in market interest rates, taking into
consideration embedded options. An effective duration of 3.0% suggests an expected price change of 3.0% for a one percent
instantaneous change in market interest rates. The credit quality of the securities portfolio remained strong with
approximately 95% of the total securities available for sale portfolio rated AAA, the highest possible rating by nationally
recognized rating agencies.
During 2009, we recognized $20.0 million of credit-related OTTI within net securities gains in the Consolidated Statements
of Income/(Loss) and $92.8 million of non-credit related OTTI within OCI. This total OTTI loss of $112.8 million relates to
securities with a fair value of approximately $310.6 million as of December 31, 2009, consisting primarily of purchased and
retained private residential MBS. These impaired securities were valued using third party pricing data, including broker
indicative bids, or expected cash flow models. See Note 5, “Securities Available for Sale,” to the Consolidated Financial
Statements for further discussion.
The amount of ARS recorded in the available for sale securities portfolio totaled $156.4 million as of December 31, 2009 and
$48.2 million as of December 31, 2008. Included in ARS are tax-exempt municipal securities in addition to student loan
ABS.
Difficult to Value Financial Assets and Liabilities
The broad credit crisis that was triggered by the 2007 subprime loan melt-down intensified throughout 2008 and, as the
broader economy continued to worsen, the credit and liquidity markets became dysfunctional. The second half of 2008 was
marked by turmoil in the financial sector, with the failure or government induced acquisitions of several large banks and
investment banks, increased unemployment, and further declines in real estate values. Additional liquidity adjustments were
made on many securities, and wider spreads caused valuing our level 3 financial instruments to become even more difficult.
Initially in 2009, we saw continued volatility with the credit crisis further eroding liquidity and investor confidence; however,
we began to experience the return of some stability in certain financial markets throughout the majority of 2009. In spite of
some improvement in the market, record high mortgage delinquencies and foreclosures led to further downward pressure on
certain private residential mortgage backed products. As a result, loss projections used by investors to estimate cash flows of
these products more than doubled during the year, particularly for 2007 vintage private MBS.
Fair value is the estimated price using market-based inputs or assumptions that would be received to sell an asset or paid to
transfer a liability in an orderly transaction between market participants at the measurement date. Current market conditions
have led to diminished, and in some cases, non-existent trading in certain of the financial asset classes that we own. We are
required to consider observable inputs, to the extent available, in the fair value estimation process, unless that data results from
forced liquidations or distressed sales. When available, we will obtain third party broker quotes or use observable market
assumptions, as these levels of evidence are the strongest support for fair value, absent current market activity in that specific
security or a similar security. Despite our best efforts to maximize the use of relevant observable inputs, the current market
environment has generally diminished the observability of trades and assumptions that have historically been available. As such,
the degree to which significant unobservable inputs have been utilized in our valuation procedures has increased over the past
two years, largely with respect to certain types of loans and securities. This decrease in observability of market data began in the
third quarter of 2007 and continued to persist in certain markets in 2009. However, we have begun to observe increased trading
activity in certain markets, such as corporate debt markets (both primary and secondary) and the market for Small Business
Administration instruments, which has provided corroborating evidence for our estimates of fair value.
The lack of liquidity, as evidenced by significant decreases in the volume and level of activity in certain markets, creates
additional challenges when estimating the fair value of certain financial instruments. Generally, the assets and liabilities most
affected by the lack of liquidity are those classified as level 3 in the fair value hierarchy. This lack of liquidity has caused us
to evaluate the performance of the underlying collateral and use a discount rate commensurate with the rate a market
participant would use to value the instrument in an orderly transaction, but that also acknowledges illiquidity premiums and
required investor rates of return that would be demanded under current market conditions. The discount rate considered the
capital structure of the instrument, market indices, and the relative yields of instruments for which third party pricing
information and/or market activity was available. In certain instances, the interest rate and credit risk components of the
valuation indicated a full return of expected principal and interest; however, the lack of liquidity resulted in wide ranges of
discounts in valuing level 3 securities. The current illiquid markets are requiring discounts of this degree to drive a market
competitive yield, as well as account for the anticipated extended tenor. The discount rates selected derived reasonable prices
when compared to (i) observable transactions, when available, (ii) other securities on a relative basis, (iii) the bid/ask spread
of non-binding broker indicative bids and/or (iv) our professional judgment. For certain securities, particularly
non-investment grade MBS, a reasonable market discount rate could not be determined using those methodologies and,
therefore, dollar prices were established based on market intelligence.
Pricing services and broker quotes were obtained when available to assist in estimating the fair value of level 3 instruments.
The number of quotes we obtained varied based on the number of brokers following a particular security, but we generally
43