SunTrust 2009 Annual Report Download - page 113
Download and view the complete annual report
Please find page 113 of the 2009 SunTrust annual report below. You can navigate through the pages in the report by either clicking on the pages listed below, or by using the keyword search tool below to find specific information within the annual report.-
 1
1 -
2
-
3
-
4
-
5
-
6
-
7
-
8
-
9
-
10
-
11
-
12
-
13
-
14
-
15
-
16
-
17
-
18
-
19
-
20
-
21
-
22
-
23
-
24
-
25
-
26
-
27
-
28
-
29
-
30
-
31
-
32
-
33
-
34
-
35
-
36
-
37
-
38
-
39
-
40
-
41
-
42
-
43
-
44
-
45
-
46
-
47
-
48
-
49
-
50
-
51
-
52
-
53
-
54
-
55
-
56
-
57
-
58
-
59
-
60
-
61
-
62
-
63
-
64
-
65
-
66
-
67
-
68
-
69
-
70
-
71
-
72
-
73
-
74
-
75
-
76
-
77
-
78
-
79
-
80
-
81
-
82
-
83
-
84
-
85
-
86
-
87
-
88
-
89
-
90
-
91
-
92
-
93
-
94
-
95
-
96
-
97
-
98
-
99
-
100
-
101
-
102
-
 103
103 -
 104
104 -
 105
105 -
 106
106 -
 107
107 -
 108
108 -
 109
109 -
 110
110 -
 111
111 -
 112
112 -
 113
113 -
 114
114 -
 115
115 -
 116
116 -
 117
117 -
 118
118 -
 119
119 -
 120
120 -
 121
121 -
 122
122 -
 123
123 -
124
-
125
-
126
-
127
-
128
-
129
-
130
-
131
-
132
-
133
-
134
-
135
-
136
-
137
-
138
-
139
-
140
-
141
-
142
-
143
-
144
-
145
-
146
-
147
-
148
-
149
-
150
-
151
-
152
-
153
-
154
-
155
-
156
-
157
-
158
-
159
-
160
-
161
-
162
-
163
-
164
-
165
-
166
-
167
-
168
-
169
-
170
-
171
-
172
-
173
-
174
-
175
-
176
-
177
-
178
-
179
-
180
-
181
-
182
-
183
-
184
-
185
-
186
 |
 |

SUNTRUST BANKS, INC.
Notes to Consolidated Financial Statements (Continued)
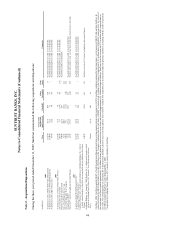
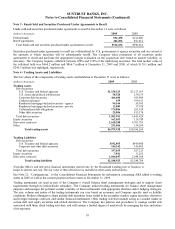
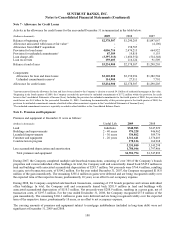
Gross realized gains and losses and OTTI on securities available for sale during the periods were as follows:
Years Ended December 31
(Dollars in thousands) 2009 2008 2007
Gross realized gains $152,075 $1,158,348 $251,076
Gross realized losses (34,056) (1,297) (7,959)
OTTI (20,000) (83,751) -
Net securities gains $98,019 $1,073,300 $243,117
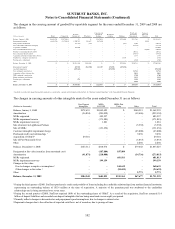
Securities with unrealized losses at December 31 were as follows:
2009
Less than twelve months Twelve months or longer Total
(Dollars in thousands)
Fair
Value
Unrealized
Losses
Fair
Value
Unrealized
Losses
Fair
Value
Unrealized
Losses
U.S. Treasury and federal agencies $6,424,579 $39,224 $263 $5 $6,424,842 $39,229
U.S. states and political subdivisions 125,524 5,711 64,516 4,918 190,040 10,629
Residential mortgage-backed securities - agency 5,418,226 61,724 - - 5,418,226 61,724
Residential mortgage-backed securities - private 14,668 4,283 327,996 95,142 342,664 99,425
Other debt securities 30,704 1,207 30,416 3,371 61,120 4,578
Total securities with unrealized losses $12,013,701 $112,149 $423,191 $103,436 $12,436,892 $215,585
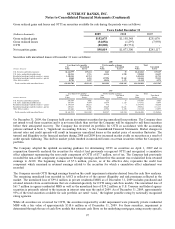
2008
Less than twelve months Twelve months or longer Total
(Dollars in thousands)
Fair
Value
Unrealized
Losses
Fair
Value
Unrealized
Losses
Fair
Value
Unrealized
Losses
U.S. Treasury and federal agencies $43,584 $302 $23 $- $43,607 $302
U.S. states and political subdivisions 169,693 4,980 14,879 1,118 184,572 6,098
Residential mortgage-backed securities - agency 3,354,319 10,223 472 7 3,354,791 10,230
Residential mortgage-backed securities - private 450,653 98,696 40,269 16,631 490,922 115,327
Other debt securities 143,666 6,901 28,944 6,158 172,610 13,059
Total securities with unrealized losses $4,161,915 $121,102 $84,587 $23,914 $4,246,502 $145,016
On December 31, 2009, the Company held certain investment securities having unrealized loss positions. The Company does
not intend to sell these securities and it is not more likely than not that the Company will be required to sell these securities
before their anticipated recovery. The Company has reviewed its portfolio for OTTI in accordance with the accounting
policies outlined in Note 1, “Significant Accounting Policies,” to the Consolidated Financial Statements. Market changes in
interest rates and credit spreads will result in temporary unrealized losses as the market price of securities fluctuates. The
turmoil and illiquidity in the financial markets during 2008 and 2009 have increased market yields on securities as a result of
credit spreads widening. This shift in market yields resulted in unrealized losses on certain securities within the Company’s
portfolio.
The Company adopted the updated accounting guidance for determining OTTI on securities on April 1, 2009 and in
conjunction therewith analyzed the securities for which it had previously recognized OTTI and recognized a cumulative
effect adjustment representing the non-credit component of OTTI of $7.7 million, net of tax. The Company had previously
recorded the non-credit component as impairment through earnings and therefore this amount was reclassified from retained
earnings to AOCI. The beginning balance of $7.6 million, pre-tax, as of the effective date, represents the credit loss
component which remained in retained earnings related to the securities for which a cumulative effect adjustment was
recorded.
The Company records OTTI through earnings based on the credit impairment estimates derived from the cash flow analyses.
The remaining unrealized loss recorded in AOCI is reflective of the current illiquidity and risk premiums reflected in the
market. The unrealized loss of $99.4 million in private residential MBS as of December 31, 2009 includes purchased and
retained interests from securitizations that are evaluated quarterly for OTTI using cash flow models. The unrealized loss of
$61.7 million in agency residential MBS as well as the unrealized loss of $39.2 million in U.S. Treasury and federal agency
securities is primarily related to the increase in interest rates near the end of 2009. As of December 31, 2009, approximately
95% of the total securities available for sale portfolio are rated “AAA,” the highest possible rating by nationally recognized
rating agencies.
While all securities are reviewed for OTTI, the securities impacted by credit impairment were primarily private residential
MBS with a fair value of approximately $310.6 million as of December 31, 2009. For these securities, impairment is
determined through the use of cash flow models that estimate cash flows on the underlying mortgages, using security specific
97