SunTrust 2009 Annual Report Download - page 41
Download and view the complete annual report
Please find page 41 of the 2009 SunTrust annual report below. You can navigate through the pages in the report by either clicking on the pages listed below, or by using the keyword search tool below to find specific information within the annual report.-
 1
1 -
2
-
3
-
4
-
5
-
6
-
7
-
8
-
9
-
10
-
11
-
12
-
13
-
14
-
15
-
16
-
17
-
18
-
19
-
20
-
21
-
22
-
23
-
24
-
25
-
26
-
27
-
28
-
29
-
30
-
 31
31 -
 32
32 -
 33
33 -
 34
34 -
 35
35 -
 36
36 -
 37
37 -
 38
38 -
 39
39 -
 40
40 -
 41
41 -
 42
42 -
 43
43 -
 44
44 -
 45
45 -
 46
46 -
 47
47 -
 48
48 -
 49
49 -
 50
50 -
 51
51 -
52
-
53
-
54
-
55
-
56
-
57
-
58
-
59
-
60
-
61
-
62
-
63
-
64
-
65
-
66
-
67
-
68
-
69
-
70
-
71
-
72
-
73
-
74
-
75
-
76
-
77
-
78
-
79
-
80
-
81
-
82
-
83
-
84
-
85
-
86
-
87
-
88
-
89
-
90
-
91
-
92
-
93
-
94
-
95
-
96
-
97
-
98
-
99
-
100
-
101
-
102
-
103
-
104
-
105
-
106
-
107
-
108
-
109
-
110
-
111
-
112
-
113
-
114
-
115
-
116
-
117
-
118
-
119
-
120
-
121
-
122
-
123
-
124
-
125
-
126
-
127
-
128
-
129
-
130
-
131
-
132
-
133
-
134
-
135
-
136
-
137
-
138
-
139
-
140
-
141
-
142
-
143
-
144
-
145
-
146
-
147
-
148
-
149
-
150
-
151
-
152
-
153
-
154
-
155
-
156
-
157
-
158
-
159
-
160
-
161
-
162
-
163
-
164
-
165
-
166
-
167
-
168
-
169
-
170
-
171
-
172
-
173
-
174
-
175
-
176
-
177
-
178
-
179
-
180
-
181
-
182
-
183
-
184
-
185
-
186
 |
 |

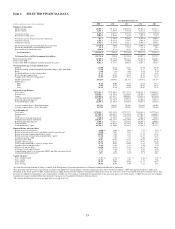
CONSOLIDATED FINANCIAL RESULTS
Table 1 - Consolidated Daily Average Balances, Income/Expense And Average Yields Earned And Rates Paid
2009 2008 2007
(Dollars in millions; yields on taxable-equivalent basis)
Average
Balances
Income/
Expense
Yields/
Rates
Average
Balances
Income/
Expense
Yields/
Rates
Average
Balances
Income/
Expense
Yields/
Rates
Assets
Loans:1
Real estate 1-4 family $28,770.3 $1,722.5 5.99 % $31,758.9 $2,004.8 6.31 % $31,951.0 $2,036.5 6.37 %
Real estate construction 5,991.0 198.1 3.31 10,828.5 575.8 5.32 13,519.4 1,011.0 7.48
Real estate home equity lines 15,685.1 523.3 3.34 15,204.9 796.9 5.24 14,031.0 1,088.2 7.76
Real estate commercial 15,573.4 639.4 4.11 13,968.9 789.7 5.65 12,803.4 887.5 6.93
Commercial - FTE236,458.0 1,819.6 4.99 38,131.9 2,089.6 5.48 34,194.4 2,202.6 6.44
Credit card 984.0 73.5 7.47 862.6 34.5 4.00 495.9 17.7 3.57
Consumer - direct 5,101.0 207.1 4.06 4,541.8 254.1 5.60 4,221.0 304.9 7.22
Consumer - indirect 6,594.0 418.0 6.34 7,262.5 459.8 6.33 8,017.5 495.4 6.18
Nonaccrual and restructured 5,883.8 36.2 0.62 2,872.7 25.4 0.89 847.0 17.3 2.05
Total loans 121,040.6 5,637.7 4.66 125,432.7 7,030.6 5.61 120,080.6 8,061.1 6.71
Securities available for sale:
Taxable 18,960.2 790.0 4.17 12,219.5 731.0 5.98 10,274.1 639.1 6.22
Tax-exempt - FTE21,002.8 54.7 5.46 1,038.4 63.1 6.07 1,043.8 62.2 5.96
Total securities available for sale - FTE 19,963.0 844.7 4.23 13,257.9 794.1 5.99 11,317.9 701.3 6.20
Funds sold and securities purchased under agreements to
resell 793.8 2.2 0.27 1,317.7 25.1 1.91 995.6 48.8 4.91
Loans held for sale 5,228.4 232.8 4.45 5,105.6 289.9 5.68 10,786.7 668.9 6.20
Interest-bearing deposits 25.3 0.2 0.91 25.6 0.8 3.18 24.0 1.3 5.44
Interest earning trading assets 3,857.3 115.4 2.99 7,609.1 304.4 4.00 11,999.6 657.2 5.48
Total earning assets 150,908.4 6,833.0 4.53 152,748.6 8,444.9 5.53 155,204.4 10,138.6 6.53
Allowance for loan and lease losses (2,705.5) (1,815.0) (1,065.7)
Cash and due from banks 4,843.6 3,093.2 3,456.6
Other assets 17,354.9 17,270.4 16,700.5
Noninterest earning trading assets 3,429.1 2,641.6 1,198.9
Unrealized gains on securities available for sale, net 1,611.9 1,909.5 2,300.8
Total assets $175,442.4 $175,848.3 $177,795.5
Liabilities and Shareholders’ Equity
Interest-bearing deposits:
NOW accounts $23,600.6 $99.2 0.42 % $21,080.7 $252.9 1.20 % $20,042.8 $473.9 2.36 %
Money market accounts 31,863.5 314.8 0.99 26,564.8 520.3 1.96 22,676.7 622.5 2.75
Savings 3,664.2 10.1 0.27 3,770.9 16.3 0.43 4,608.7 55.5 1.20
Consumer time 16,718.1 479.0 2.87 16,770.2 639.1 3.81 16,941.3 764.2 4.51
Other time 13,068.4 382.1 2.92 12,197.2 478.6 3.92 12,073.5 586.3 4.86
Total interest-bearing consumer and commercial
deposits 88,914.8 1,285.2 1.45 80,383.8 1,907.2 2.37 76,343.0 2,502.4 3.28
Brokered deposits 5,648.3 154.2 2.69 10,493.2 391.5 3.73 16,091.9 861.2 5.35
Foreign deposits 433.9 0.5 0.12 4,250.3 78.8 1.85 5,764.5 297.2 5.16
Total interest-bearing deposits 94,997.0 1,439.9 1.52 95,127.3 2,377.5 2.50 98,199.4 3,660.8 3.73
Funds purchased 1,669.6 3.3 0.19 2,622.0 51.5 1.96 3,266.2 166.5 5.10
Securities sold under agreements to repurchase 2,483.4 4.5 0.18 4,961.0 79.1 1.59 6,132.5 273.8 4.46
Interest-bearing trading liabilities 487.8 20.2 4.14 785.7 27.1 3.46 430.2 15.6 3.62
Other short-term borrowings 2,703.6 14.7 0.54 3,057.2 55.1 1.80 2,493.0 121.0 4.85
Long-term debt 20,118.7 761.4 3.78 22,892.9 1,117.4 4.88 20,692.9 1,078.7 5.21
Total interest-bearing liabilities 122,460.1 2,244.0 1.83 129,446.1 3,707.7 2.86 131,214.2 5,316.4 4.05
Noninterest-bearing deposits 24,249.2 20,949.0 21,677.2
Other liabilities 4,387.2 5,061.4 5,662.7
Noninterest-bearing trading liabilities 2,059.8 1,795.6 1,313.0
Shareholders’ equity 22,286.1 18,596.2 17,928.4
Total liabilities and shareholders’ equity $175,442.4 $175,848.3 $177,795.5
Interest Rate Spread 2.70 % 2.67 % 2.48 %
Net Interest Income - FTE 3$4,589.0 $4,737.2 $4,822.2
Net Interest Margin 43.04 % 3.10 % 3.11 %
1Interest income includes loan fees of $140.6 million, $134.5 million, and $119.8 million for the three years ended December 31, 2009, 2008, and 2007, respectively. Nonaccrual loans are included in average
balances and income on such loans, if recognized, is recorded on a cash basis.
2Interest income includes the effects of taxable-equivalent adjustments using a federal income tax rate of 35% and, where applicable, state income taxes to increase tax-exempt interest income to a taxable-
equivalent basis. The net taxable-equivalent adjustment amounts included in the above table aggregated $123.3 million, $117.5 million, and $102.7 million for the three years ended December 31, respectively.
3The Company obtained derivative instruments to manage the Company’s interest-sensitivity position that increased net interest income $488.2 million and $180.7 million in the periods ended December 31,
2009 and 2008, respectively and decreased net interest income $25.6 million in the period ended December 31, 2007.
4The net interest margin is calculated by dividing net interest income – FTE by average total earning assets.
25