SunTrust 2009 Annual Report Download - page 50
Download and view the complete annual report
Please find page 50 of the 2009 SunTrust annual report below. You can navigate through the pages in the report by either clicking on the pages listed below, or by using the keyword search tool below to find specific information within the annual report.-
 1
1 -
2
-
3
-
4
-
5
-
6
-
7
-
8
-
9
-
10
-
11
-
12
-
13
-
14
-
15
-
16
-
17
-
18
-
19
-
20
-
21
-
22
-
23
-
24
-
25
-
26
-
27
-
28
-
29
-
30
-
31
-
32
-
33
-
34
-
35
-
36
-
37
-
38
-
39
-
 40
40 -
 41
41 -
 42
42 -
 43
43 -
 44
44 -
 45
45 -
 46
46 -
 47
47 -
 48
48 -
 49
49 -
 50
50 -
 51
51 -
 52
52 -
 53
53 -
 54
54 -
 55
55 -
 56
56 -
 57
57 -
 58
58 -
 59
59 -
 60
60 -
61
-
62
-
63
-
64
-
65
-
66
-
67
-
68
-
69
-
70
-
71
-
72
-
73
-
74
-
75
-
76
-
77
-
78
-
79
-
80
-
81
-
82
-
83
-
84
-
85
-
86
-
87
-
88
-
89
-
90
-
91
-
92
-
93
-
94
-
95
-
96
-
97
-
98
-
99
-
100
-
101
-
102
-
103
-
104
-
105
-
106
-
107
-
108
-
109
-
110
-
111
-
112
-
113
-
114
-
115
-
116
-
117
-
118
-
119
-
120
-
121
-
122
-
123
-
124
-
125
-
126
-
127
-
128
-
129
-
130
-
131
-
132
-
133
-
134
-
135
-
136
-
137
-
138
-
139
-
140
-
141
-
142
-
143
-
144
-
145
-
146
-
147
-
148
-
149
-
150
-
151
-
152
-
153
-
154
-
155
-
156
-
157
-
158
-
159
-
160
-
161
-
162
-
163
-
164
-
165
-
166
-
167
-
168
-
169
-
170
-
171
-
172
-
173
-
174
-
175
-
176
-
177
-
178
-
179
-
180
-
181
-
182
-
183
-
184
-
185
-
186
 |
 |

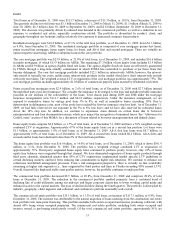
income properties such as office buildings, warehouses and retail buildings. Given conditions in the commercial real estate
market, we anticipate continued stress and credit losses in this portfolio; however, we expect it to perform relatively well
given its composition and underwriting.
The construction portfolio was $6.6 billion, or 5.8% of total loans, at December 31, 2009, a decrease of $3.2 billion, or
32.6%, from December 31, 2008. The construction portfolio consists of $0.8 billion of residential construction to perm loans,
$1.2 billion of residential construction loans, $1.9 billion of commercial construction loans, $1.8 billion of acquisition and
development loans, and $0.9 billion of undeveloped land loans. We have reduced the level of risk in the construction
portfolio by aggressively managing our construction exposure. This reduction is evident from the $7.1 billion, or 51.8%,
decline in outstanding balances since December 2007. Commercial related construction loans represent 28.5% of the total
construction portfolio and credit performance remains acceptable overall. Performance of residential construction related
loans remained weak; however, during the fourth quarter 30 days + delinquencies declined. We continue to be proactive in
our credit monitoring and management processes to provide early warning for problem loans in the portfolio. For example,
we use an expanded liquidity and contingency analysis to provide a thorough view of borrower capacity and their ability to
service obligations in a steep market decline. We also have strict limits and exposure caps on specific projects and borrowers
for risk diversification. Due to the lack of new construction projects and the completion of many that were previously started,
the aggregate amount of interest reserves that we are obligated to fund is down from prior periods.
The indirect consumer portfolio was $6.5 billion, or 5.7% of total loans, at December 31, 2009, up $23.5 million, or 0.4%,
from December 31, 2008. The increase is partially attributable to new vehicle sales triggered by the federal government
“Cash for Clunkers” incentive program. This portfolio is experiencing a reduced level of charge-offs compared to 2008 and
is benefiting from lower fuel prices, stabilized used car values, and natural turnover into newly underwritten vintages.
The direct consumer portfolio was $5.1 billion, or 4.5% of total loans, at December 31, 2009, down $21.5 million, or 0.4%,
from December 31, 2008. Student loans, which are mostly government supported, made up $3.1 billion, or approximately
61% of the direct consumer portfolio. This portfolio also includes loans and lines to individuals for personal or family uses.
The increase in LHFS of $637.7 million, or 15.8%, is due primarily to higher levels of mortgage loan originations.
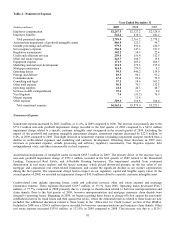
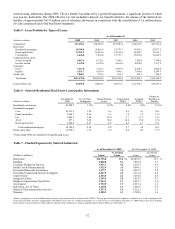
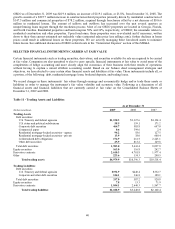
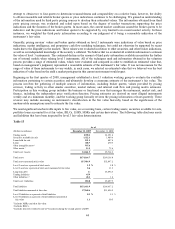
Table 8 - Allowance for Loan and Lease Losses
(Dollars in millions) As of December 31
Allocation by Loan Type 2009 2008 2007 2006 2005
Commercial $650.0 $631.2 $422.6 $415.9 $439.6
Real estate 2,268.0 1,523.2 664.6 443.1 394.1
Consumer loans 202.0 196.6 110.3 95.5 109.4
Unallocated 1-- 85.0 90.0 85.0
Total $3,120.0 $2,351.0 $1,282.5 $1,044.5 $1,028.1
As of December 31
Year-end Loan Types as a Percent of Total Loans 2009 2008 2007 2006 2005
Commercial 28.6 % 32.3 % 29.4 % 28.8 % 29.2 %
Real estate 60.2 57.8 60.6 61.2 58.7
Consumer loans 11.2 9.9 10.0 10.0 12.1
Total 100.00 % 100.00 % 100.00 % 100.00 % 100.00 %
1Beginning in 2008, the unallocated reserve is reflected in our homogeneous pool estimates.
34