SunTrust 2009 Annual Report Download - page 57
Download and view the complete annual report
Please find page 57 of the 2009 SunTrust annual report below. You can navigate through the pages in the report by either clicking on the pages listed below, or by using the keyword search tool below to find specific information within the annual report.-
 1
1 -
2
-
3
-
4
-
5
-
6
-
7
-
8
-
9
-
10
-
11
-
12
-
13
-
14
-
15
-
16
-
17
-
18
-
19
-
20
-
21
-
22
-
23
-
24
-
25
-
26
-
27
-
28
-
29
-
30
-
31
-
32
-
33
-
34
-
35
-
36
-
37
-
38
-
39
-
40
-
41
-
42
-
43
-
44
-
45
-
46
-
 47
47 -
 48
48 -
 49
49 -
 50
50 -
 51
51 -
 52
52 -
 53
53 -
 54
54 -
 55
55 -
 56
56 -
 57
57 -
 58
58 -
 59
59 -
 60
60 -
 61
61 -
 62
62 -
 63
63 -
 64
64 -
 65
65 -
 66
66 -
 67
67 -
68
-
69
-
70
-
71
-
72
-
73
-
74
-
75
-
76
-
77
-
78
-
79
-
80
-
81
-
82
-
83
-
84
-
85
-
86
-
87
-
88
-
89
-
90
-
91
-
92
-
93
-
94
-
95
-
96
-
97
-
98
-
99
-
100
-
101
-
102
-
103
-
104
-
105
-
106
-
107
-
108
-
109
-
110
-
111
-
112
-
113
-
114
-
115
-
116
-
117
-
118
-
119
-
120
-
121
-
122
-
123
-
124
-
125
-
126
-
127
-
128
-
129
-
130
-
131
-
132
-
133
-
134
-
135
-
136
-
137
-
138
-
139
-
140
-
141
-
142
-
143
-
144
-
145
-
146
-
147
-
148
-
149
-
150
-
151
-
152
-
153
-
154
-
155
-
156
-
157
-
158
-
159
-
160
-
161
-
162
-
163
-
164
-
165
-
166
-
167
-
168
-
169
-
170
-
171
-
172
-
173
-
174
-
175
-
176
-
177
-
178
-
179
-
180
-
181
-
182
-
183
-
184
-
185
-
186
 |
 |
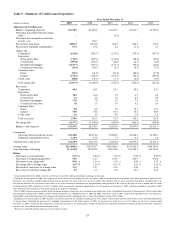
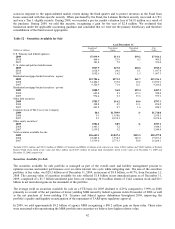
Trading Assets and Liabilities
Trading assets decreased $5.4 billion, or 52.1%, since December 31, 2008. The majority of the decrease consisted of a $3.5
billion reduction in trading debt securities, which was primarily driven by the sale in the first quarter of 2009 of
approximately $2.0 billion of our agency trading portfolio that consisted of FHLB floating rate notes. The sale of these
securities was completed primarily to reduce low yielding securities and improve margin.
CP decreased $399.0 million from $399.6 million at December 31, 2008 to $0.6 million at December 31, 2009. The decrease
is primarily due to the discontinuation of the Federal Reserve Bank of Boston’s ABCP MMMF Liquidity Facility program
that was implemented in 2008 which allowed eligible depository institutions, bank holding companies, and affiliated broker/
dealers to purchase certain ABCP from certain MMMF.
Other debt securities decreased $787.3 million during the year ended December 31, 2009. Of this decrease, $603.4 million
was the result of the temporary suspension and wind-down of the TRS business. See Note 11, “Certain Transfers of Financial
Assets, Mortgage Servicing Rights and Variable Interest Entities”, to the Consolidated Financial Statements for additional
information regarding our TRS business.
Derivative assets and liabilities also decreased in 2009 by $2.1 billion and $0.8 billion, respectively, of which $1.5 billion and
$655.1 million, respectively, was driven by the movements in fair values of interest rate based derivatives including $184.1
million in terminated interest rate swaps on FHLB advances that were repaid in the first quarter of 2009. In addition, $249.5
million of the decrease in derivative assets was due to the decline in fair value of our cash flow hedges related to the probable
forecasted sale of Coke common shares, which change in fair value also increased the derivative liabilities by $45.9 million. The
termination of TRS transactions resulted in the decrease of derivative assets and liabilities during 2009 of $171.0 million and
$166.6 million, respectively. The remaining decrease in derivative assets and liabilities was primarily due to the partial
termination of cross currency swaps hedging foreign denominated debt and the changes in fair value of those hedge positions
still outstanding.
Certain ABS were purchased during the fourth quarter of 2007 from affiliates and certain ARS were purchased primarily in
the fourth quarter of 2008 and first quarter of 2009. The securities acquired during the fourth quarter of 2007 included SIVs
(that are collateralized by various domestic and foreign assets), residential MBS (including Alt-A and subprime collateral),
CDO, and commercial loans, as well as super-senior interests retained from Company-sponsored securitizations. During the
year ended December 31, 2009, we recognized approximately $24.2 million in net market valuation gains related to these
ABS. Through sales, maturities and write downs, we reduced our exposure to these distressed assets by approximately $3.3
billion since the acquisition in the fourth quarter of 2007, reducing the exposure at December 31, 2009 to approximately
$159.3 million. During 2009, we received approximately $6.5 million in sales proceeds and $108.5 million in payments
related to securities acquired during the fourth quarter of 2007.
We continue to actively evaluate our holdings of these securities with the objective of opportunistically lowering our
exposure to them. In addition, we expect paydowns to continue on many of the residential MBS. All but a small amount of
the remaining acquired asset portfolio consists of SIVs undergoing enforcement proceedings and, therefore, any significant
reduction in the portfolio will largely depend on the status of those proceedings. During the second quarter of 2009, one of
our three remaining SIVs liquidated as a result of the completion of enforcement proceedings; this liquidation resulted in
proceeds of $18.6 million and a realized gain of $1.8 million, due to the liquidation value being slightly above our recorded
fair value, that was recorded in trading account profits/(losses) and commissions in the Consolidated Statements of Income/
(Loss) for the year ended December 31, 2009. During 2009, we received approximately $65.0 million in partial payments on
the remaining SIVs undergoing enforcement. While further losses are possible, our experience during 2008 and 2009
reinforces our belief that we have appropriately written these assets down to fair value as of December 31, 2009. The
estimated market value of these securities is based on market information, where available, along with significant,
unobservable third party data. As a result of the high degree of judgment and estimates used to value these illiquid securities,
the market values could vary significantly in future periods. See “Difficult to Value Financial Assets and Liabilities”
included in this MD&A for more information.
The amount of ARS recorded in trading assets at fair value totaled $176.4 million at December 31, 2009 and $133.1 million
at December 31, 2008. The majority of these ARS are preferred equity securities, and the remaining securities consist of
ABS backed by trust preferred bank debt or student loans.
In September 2008, we purchased, at amortized cost plus accrued interest, a Lehman Brothers security from the RidgeWorth
Prime Quality Money Market Fund (the “Fund”). The Fund received a cash payment for the accrued interest along with a $70
million note that we issued. RidgeWorth, one of our wholly-owned subsidiaries, is the investment adviser to the Fund. The
Lehman Brothers security went into default when Lehman Brothers filed for bankruptcy in September 2008. We took this
41