SunTrust 2009 Annual Report Download - page 56
Download and view the complete annual report
Please find page 56 of the 2009 SunTrust annual report below. You can navigate through the pages in the report by either clicking on the pages listed below, or by using the keyword search tool below to find specific information within the annual report.-
 1
1 -
2
-
3
-
4
-
5
-
6
-
7
-
8
-
9
-
10
-
11
-
12
-
13
-
14
-
15
-
16
-
17
-
18
-
19
-
20
-
21
-
22
-
23
-
24
-
25
-
26
-
27
-
28
-
29
-
30
-
31
-
32
-
33
-
34
-
35
-
36
-
37
-
38
-
39
-
40
-
41
-
42
-
43
-
44
-
45
-
 46
46 -
 47
47 -
 48
48 -
 49
49 -
 50
50 -
 51
51 -
 52
52 -
 53
53 -
 54
54 -
 55
55 -
 56
56 -
 57
57 -
 58
58 -
 59
59 -
 60
60 -
 61
61 -
 62
62 -
 63
63 -
 64
64 -
 65
65 -
 66
66 -
67
-
68
-
69
-
70
-
71
-
72
-
73
-
74
-
75
-
76
-
77
-
78
-
79
-
80
-
81
-
82
-
83
-
84
-
85
-
86
-
87
-
88
-
89
-
90
-
91
-
92
-
93
-
94
-
95
-
96
-
97
-
98
-
99
-
100
-
101
-
102
-
103
-
104
-
105
-
106
-
107
-
108
-
109
-
110
-
111
-
112
-
113
-
114
-
115
-
116
-
117
-
118
-
119
-
120
-
121
-
122
-
123
-
124
-
125
-
126
-
127
-
128
-
129
-
130
-
131
-
132
-
133
-
134
-
135
-
136
-
137
-
138
-
139
-
140
-
141
-
142
-
143
-
144
-
145
-
146
-
147
-
148
-
149
-
150
-
151
-
152
-
153
-
154
-
155
-
156
-
157
-
158
-
159
-
160
-
161
-
162
-
163
-
164
-
165
-
166
-
167
-
168
-
169
-
170
-
171
-
172
-
173
-
174
-
175
-
176
-
177
-
178
-
179
-
180
-
181
-
182
-
183
-
184
-
185
-
186
 |
 |

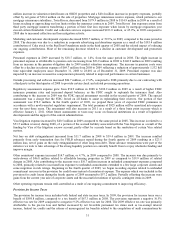
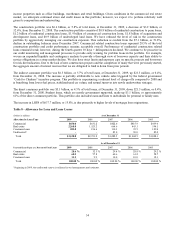
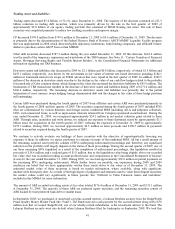
OREO as of December 31, 2009 was $619.6 million, an increase of $119.1 million, or 23.8%, from December 31, 2008. The
growth consists of a $225.7 million increase in construction-related properties primarily driven by residential construction of
$147.5 million and commercial properties of $78.2 million, acquired through foreclosure offset by a net decrease of $106.6
million in residential homes. The amount of inflows and outflows has increased over the past several quarters as
nonperforming loans migrate through the resolution process. Most of our OREO properties are located in Georgia, Florida,
and North Carolina. Residential properties and land comprise 50% and 36%, respectively, of OREO; the remainder relates to
residential construction and other properties. Upon foreclosure, these properties were re-evaluated and if necessary, written
down to their then current estimated net realizable value (estimated sales price less selling costs); further declines in home
prices could result in additional losses on these properties. We are actively managing these foreclosed assets to minimize
future losses. See additional discussion of OREO-related costs in the “Noninterest Expense” section of this MD&A.
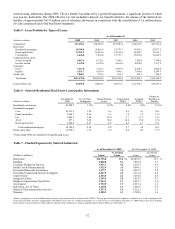
SELECTED FINANCIAL INSTRUMENTS CARRIED AT FAIR VALUE
Certain financial instruments such as trading securities, derivatives, and securities available for sale are required to be carried
at fair value. Companies are also permitted to elect to carry specific financial instruments at fair value to avoid some of the
complexities of hedge accounting and more closely align the economics of their business with their results of operations
without having to explain a mixed attribute accounting model. Based on our balance sheet management strategies and
objectives, we have elected to carry certain other financial assets and liabilities at fair value. These instruments include all, or
a portion, of the following: debt, residential mortgage loans, brokered deposits, and trading loans.
We record changes in these instruments’ fair values through earnings and economically hedge and/or trade these assets or
liabilities in order to manage the instrument’s fair value volatility and economic value. Following is a discussion of all
financial assets and financial liabilities that are currently carried at fair value on the Consolidated Balance Sheets at
December 31, 2009 and 2008.
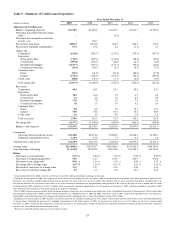
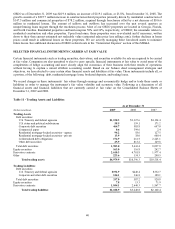
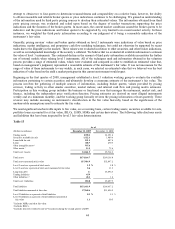
Table 11 - Trading Assets and Liabilities
As of December 31
(Dollars in millions) 2009 2008 2007
Trading Assets
Debt securities:
U.S. Treasury and federal agencies $1,150.3 $3,127.6 $4,194.4
U.S. states and political subdivisions 58.5 159.1 171.2
Corporate debt securities 464.7 585.8 607.0
Commercial paper 0.6 399.6 2.4
Residential mortgage-backed securities - agency 94.2 58.6 127.5
Residential mortgage-backed securities - private 13.9 38.0 600.4
Collateralized debt obligations 174.9 261.5 2,245.1
Other debt securities 25.9 813.2 149.8
Total debt securities 1,983.0 5,443.4 8,097.8
Equity securities 163.0 116.8 242.7
Derivative contracts 2,610.3 4,701.8 1,977.4
Other 223.6 134.3 200.5
Total trading assets $4,979.9 $10,396.3 $10,518.4
Trading Liabilities
Debt securities:
U.S. Treasury and federal agencies $192.9 $440.4 $332.7
Corporate and other debt securities 144.1 146.8 188.1
Total debt securities 337.0 587.2 520.8
Equity securities 7.8 13.3 71.9
Derivative contracts 1,844.1 2,640.3 1,567.7
Total trading liabilities $2,188.9 $3,240.8 $2,160.4
40