SunTrust 2009 Annual Report Download - page 140
Download and view the complete annual report
Please find page 140 of the 2009 SunTrust annual report below. You can navigate through the pages in the report by either clicking on the pages listed below, or by using the keyword search tool below to find specific information within the annual report.-
 1
1 -
2
-
3
-
4
-
5
-
6
-
7
-
8
-
9
-
10
-
11
-
12
-
13
-
14
-
15
-
16
-
17
-
18
-
19
-
20
-
21
-
22
-
23
-
24
-
25
-
26
-
27
-
28
-
29
-
30
-
31
-
32
-
33
-
34
-
35
-
36
-
37
-
38
-
39
-
40
-
41
-
42
-
43
-
44
-
45
-
46
-
47
-
48
-
49
-
50
-
51
-
52
-
53
-
54
-
55
-
56
-
57
-
58
-
59
-
60
-
61
-
62
-
63
-
64
-
65
-
66
-
67
-
68
-
69
-
70
-
71
-
72
-
73
-
74
-
75
-
76
-
77
-
78
-
79
-
80
-
81
-
82
-
83
-
84
-
85
-
86
-
87
-
88
-
89
-
90
-
91
-
92
-
93
-
94
-
95
-
96
-
97
-
98
-
99
-
100
-
101
-
102
-
103
-
104
-
105
-
106
-
107
-
108
-
109
-
110
-
111
-
112
-
113
-
114
-
115
-
116
-
117
-
118
-
119
-
120
-
121
-
122
-
123
-
124
-
125
-
126
-
127
-
128
-
129
-
 130
130 -
 131
131 -
 132
132 -
 133
133 -
 134
134 -
 135
135 -
 136
136 -
 137
137 -
 138
138 -
 139
139 -
 140
140 -
 141
141 -
 142
142 -
 143
143 -
 144
144 -
 145
145 -
 146
146 -
 147
147 -
 148
148 -
 149
149 -
 150
150 -
151
-
152
-
153
-
154
-
155
-
156
-
157
-
158
-
159
-
160
-
161
-
162
-
163
-
164
-
165
-
166
-
167
-
168
-
169
-
170
-
171
-
172
-
173
-
174
-
175
-
176
-
177
-
178
-
179
-
180
-
181
-
182
-
183
-
184
-
185
-
186
 |
 |

SUNTRUST BANKS, INC.
Notes to Consolidated Financial Statements (Continued)
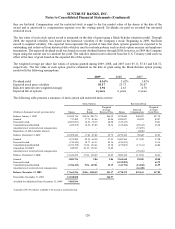
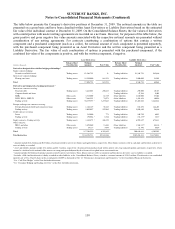
The expected long-term rate of return on plan assets was 8.00% and 8.25% in 2009 and 2008, respectively. The expected
long-term rate of return is 8.00% for 2010. The asset allocation for the Pension Plans and the target allocation, by asset
category, are as follows:
Target
Allocation1
Percentage of Plan Assets
at December 312
Asset Category 2010 2009 2008
Equity securities 55-75% 61% 62 %
Debt securities 25-45 37 35
Cash equivalents 0-5 2 3
Total 100% 100 %
1SunTrust Pension Plan only.
2SunTrust and NCF Pension Plans.
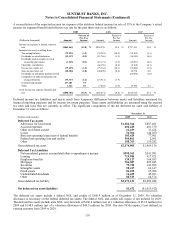
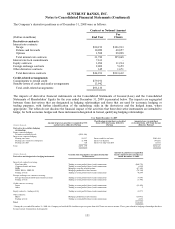
The fair value of plan assets is measured based on the fair value hierarchy which is discussed in detail in Note 20, “Fair
Value Election and Measurement” to the Consolidated Financial Statements. The valuations are based on third party data
received as of the balance sheet date. Level 1 assets such as equity securities, mutual funds, and REITS are instruments that
are traded in active markets and are valued based on identical instruments. Fixed income securities and common and
collective trust funds are classified as level 2 assets because there is not an identical asset in the market upon which to base
the valuation; however, there are no significant unobservable assumptions used to value level 2 instruments. Level 3 assets
primarily consist of private placement and non-investment grade bonds. Limited visible market activity exists for these
instruments or similar instruments and therefore significant unobservable assumptions are used to value the securities.
The following table sets forth by level, within the fair value hierarchy, plan assets related to Pension Benefits at fair value as
of December 31, 2009:
Fair Value Measurements at
December 31, 2009 Using 1
(Dollars in thousands)
Assets Measured at
Fair Value December 31,
2009
Quoted Prices In
Active Markets for
Identical Assets
(Level 1)
Significant Other
Observable Inputs
(Level 2)
Significant
Unobservable Inputs
(Level 3)
Money market funds $55,053 $55,053 $- $-
Mutual funds:
Fixed income funds 96,617 96,617 - -
International diversified funds 356,614 356,614 - -
Large cap funds 263,052 263,052 - -
Small and mid cap funds 214,082 214,082 - -
Equity securities:
Consumer 100,505 100,505 - -
Energy and utilities 40,103 40,103 - -
Financials 43,904 43,904 - -
Healthcare 65,182 65,182 - -
Industrials 51,461 51,461 - -
Information technology 157,471 157,471 - -
Materials 19,909 19,909 - -
Exchange traded funds 98,330 98,330 - -
Fixed income securities:
Corporate - investment grade 554,307 - 471,645 82,662
Corporate - non-investment grade 25,822 - - 25,822
Foreign bonds 177,222 - 139,396 37,826
Other 1,311 - 389 922
Real estate investment trusts 182 182 - -
$2,321,127 $1,562,465 $611,430 $147,232
1Schedule does not include accrued income amounting to less than 0.6% of total plan assets.
124