SunTrust 2009 Annual Report Download - page 53
Download and view the complete annual report
Please find page 53 of the 2009 SunTrust annual report below. You can navigate through the pages in the report by either clicking on the pages listed below, or by using the keyword search tool below to find specific information within the annual report.-
 1
1 -
2
-
3
-
4
-
5
-
6
-
7
-
8
-
9
-
10
-
11
-
12
-
13
-
14
-
15
-
16
-
17
-
18
-
19
-
20
-
21
-
22
-
23
-
24
-
25
-
26
-
27
-
28
-
29
-
30
-
31
-
32
-
33
-
34
-
35
-
36
-
37
-
38
-
39
-
40
-
41
-
42
-
 43
43 -
 44
44 -
 45
45 -
 46
46 -
 47
47 -
 48
48 -
 49
49 -
 50
50 -
 51
51 -
 52
52 -
 53
53 -
 54
54 -
 55
55 -
 56
56 -
 57
57 -
 58
58 -
 59
59 -
 60
60 -
 61
61 -
 62
62 -
 63
63 -
64
-
65
-
66
-
67
-
68
-
69
-
70
-
71
-
72
-
73
-
74
-
75
-
76
-
77
-
78
-
79
-
80
-
81
-
82
-
83
-
84
-
85
-
86
-
87
-
88
-
89
-
90
-
91
-
92
-
93
-
94
-
95
-
96
-
97
-
98
-
99
-
100
-
101
-
102
-
103
-
104
-
105
-
106
-
107
-
108
-
109
-
110
-
111
-
112
-
113
-
114
-
115
-
116
-
117
-
118
-
119
-
120
-
121
-
122
-
123
-
124
-
125
-
126
-
127
-
128
-
129
-
130
-
131
-
132
-
133
-
134
-
135
-
136
-
137
-
138
-
139
-
140
-
141
-
142
-
143
-
144
-
145
-
146
-
147
-
148
-
149
-
150
-
151
-
152
-
153
-
154
-
155
-
156
-
157
-
158
-
159
-
160
-
161
-
162
-
163
-
164
-
165
-
166
-
167
-
168
-
169
-
170
-
171
-
172
-
173
-
174
-
175
-
176
-
177
-
178
-
179
-
180
-
181
-
182
-
183
-
184
-
185
-
186
 |
 |
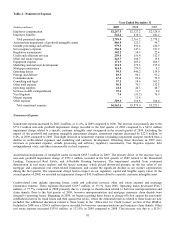
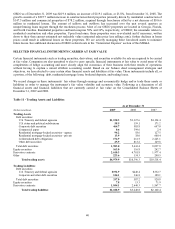
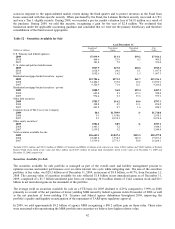
We continually evaluate our ALLL methodology seeking to refine and enhance this process as appropriate, and it is likely
that the methodology will continue to evolve over time. As of December 31, 2009, the general allowance totaled $2,582.0
million. This compares to a general allowance totaling $2,149.2 million as of December 31, 2008. The increase was primarily
driven by declining home prices and the associated deterioration in credit quality of the residential mortgage and home equity
lines of credit portfolios. Increases to the commercial related reserves were driven by higher expected loss factors.
Our charge-off policy meets or exceeds regulatory minimums. Losses on unsecured consumer loans are recognized at 90
days past due compared to the regulatory loss criteria of 120 days. Secured consumer loans, including residential real estate,
are typically charged down to net realizable value at 120 and 180 days delinquent, depending on the collateral type, in
compliance with FFIEC guidelines. Commercial loans and real estate loans are typically placed on nonaccrual status when
principal or interest is past due for 90 days or more unless the loan is both secured by collateral having value sufficient to
discharge the debt in full and the loan is in the legal process of collection. Accordingly, secured loans may be charged down
or reserves established to the estimated value of the collateral with previously accrued unpaid interest reversed. Subsequent
reserves and/or charge-offs may be required as a result of changes in the market value of collateral or other repayment
prospects. Initial reserves and/or charge-off amounts are based on valuation estimates derived from either appraisals, broker
price opinions, or other market information. Generally, updated appraisals are received within 90 days of the foreclosure
process. However, collateral values are updated and reviewed periodically based on market information from multiple
sources.
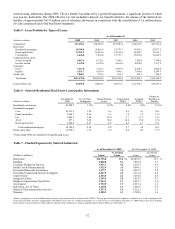
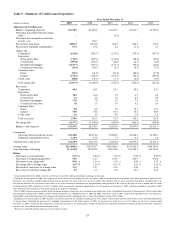
Net charge-offs during 2009 were $3.2 billion, an increase of $1.7 billion from 2008. Net charge-offs to average loans ratio
was 2.67% and 1.25% as of December 31, 2009 and 2008, respectively. The increase in net charge-offs reflects the effects of
the housing crisis and related economic downturn. The largest increases were seen in residential mortgage ($700.6 million),
commercial ($377.8 million), real estate construction ($307.7 million) and home equity lines ($251.5 million). We do not
originate subprime consumer real estate loans; however lower residential real estate values and recessionary economic
conditions have affected borrowers of higher credit quality. Construction net charge-offs increased due to the resolution of
loan workouts in the residential builder construction portfolio. The increase in commercial net charge-offs was driven by
relatively fewer, but larger credits in unrelated, economically cyclical industries as well as small businesses. During the
fourth quarter of 2009, net charge-offs declined across most loan categories, except residential construction, which increased
as a result of continued workout activities. Overall, our outlook is for elevated net charge-offs in the near term, particularly
related to residential mortgages associated with loans migrating to foreclosure, with the possibility that improvement could
begin in the second half of 2010 depending on the strength and pace of economic recovery.
The ratio of the ALLL to total nonperforming loans decreased to 58.9% as of December 31, 2009 from 61.7% as of
December 31, 2008. The decline in this ratio was due to a $1.5 billion increase in nonperforming loans compared to 2008,
driven primarily by increases in residential mortgage and real estate construction nonperforming loans, partially offset by the
$769.0 million increase in the ALLL. The increase in nonperforming loans was driven primarily by deteriorating economic
conditions and declining home values in most markets that we serve as well as home builders and commercial loans in
economically sensitive businesses. We write down residential nonperforming loans to the expected value of the underlying
collateral, less estimated selling costs as measured at the time the loan is 180 days past due. Declines, if any, in the collateral
value of the nonperforming loans subsequent to the initial charge-off are captured in the ALLL and then recognized as
additional charge-offs upon foreclosure. The charge-off is applied against the ALLL; therefore, the relationship between
ALLL and nonperforming loans becomes less correlated since the carrying value of such charged-off nonperforming loans
has already recognized losses that are estimated to be realized at that point in time. Another factor that impacts the ALLL to
nonperforming loans ratio is that most of the nonperforming loans have some amount of net residual value; therefore, while
the entire loan is classified as nonperforming, only the amount of estimated losses that has not already been charged-off
would be captured in the ALLL. Product mix of nonperforming loans and the related charge-off practices are relevant
considerations in the evaluation of ALLL coverage of nonperforming loans.
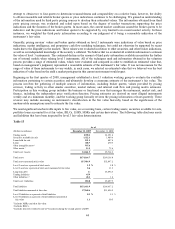
The reserve for unfunded commitments was $114.9 million and $27.5 million as of December 31, 2009 and December 31,
2008, respectively. Lending commitments such as letters of credit and binding unfunded loan commitments are assessed
similarly to funded wholesale loans except utilization assumptions are considered. Larger nonperforming unfunded
commitments and letters of credit are individually evaluated for loss content. The $87.4 million increase in the reserve for
unfunded commitments reflects the deterioration in the overall economy and credit conditions during the year. We do not
anticipate this level of growth to continue during 2010 unless the economic environment deteriorates significantly.
Provision for Credit Losses
The provision for credit losses includes both the provision for loan losses, relating to funded loans, as well as the provision
for unfunded commitments. The provision for loan losses is the result of a detailed analysis estimating an appropriate and
adequate ALLL. The provision for loan losses during 2009 totaled $4.0 billion, an increase of $1.5 billion, or 61.9%, from
2008. The increase in the provision for loan losses is primarily driven by elevated losses and increases in ALLL due to
37