SunTrust 2009 Annual Report Download - page 165
Download and view the complete annual report
Please find page 165 of the 2009 SunTrust annual report below. You can navigate through the pages in the report by either clicking on the pages listed below, or by using the keyword search tool below to find specific information within the annual report.-
 1
1 -
2
-
3
-
4
-
5
-
6
-
7
-
8
-
9
-
10
-
11
-
12
-
13
-
14
-
15
-
16
-
17
-
18
-
19
-
20
-
21
-
22
-
23
-
24
-
25
-
26
-
27
-
28
-
29
-
30
-
31
-
32
-
33
-
34
-
35
-
36
-
37
-
38
-
39
-
40
-
41
-
42
-
43
-
44
-
45
-
46
-
47
-
48
-
49
-
50
-
51
-
52
-
53
-
54
-
55
-
56
-
57
-
58
-
59
-
60
-
61
-
62
-
63
-
64
-
65
-
66
-
67
-
68
-
69
-
70
-
71
-
72
-
73
-
74
-
75
-
76
-
77
-
78
-
79
-
80
-
81
-
82
-
83
-
84
-
85
-
86
-
87
-
88
-
89
-
90
-
91
-
92
-
93
-
94
-
95
-
96
-
97
-
98
-
99
-
100
-
101
-
102
-
103
-
104
-
105
-
106
-
107
-
108
-
109
-
110
-
111
-
112
-
113
-
114
-
115
-
116
-
117
-
118
-
119
-
120
-
121
-
122
-
123
-
124
-
125
-
126
-
127
-
128
-
129
-
130
-
131
-
132
-
133
-
134
-
135
-
136
-
137
-
138
-
139
-
140
-
141
-
142
-
143
-
144
-
145
-
146
-
147
-
148
-
149
-
150
-
151
-
152
-
153
-
154
-
 155
155 -
 156
156 -
 157
157 -
 158
158 -
 159
159 -
 160
160 -
 161
161 -
 162
162 -
 163
163 -
 164
164 -
 165
165 -
 166
166 -
 167
167 -
 168
168 -
 169
169 -
 170
170 -
 171
171 -
 172
172 -
 173
173 -
 174
174 -
 175
175 -
176
-
177
-
178
-
179
-
180
-
181
-
182
-
183
-
184
-
185
-
186
 |
 |

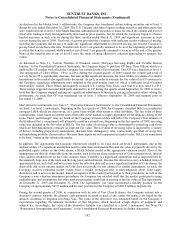
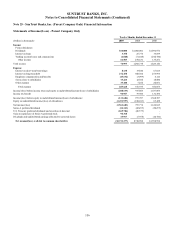
SUNTRUST BANKS, INC.
Notes to Consolidated Financial Statements (Continued)
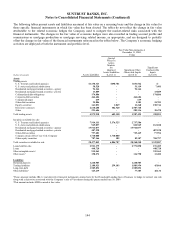
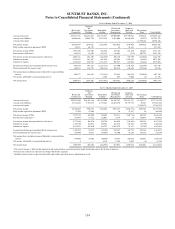
The following tables present the difference between the aggregate fair value and the aggregate unpaid principal balance of
trading assets, loans, LHFS, brokered deposits, and long-term debt instruments for which the FVO has been elected. For
loans and LHFS for which the FVO has been elected, the tables also include the difference between aggregate fair value and
the aggregate unpaid principal balance of loans that are 90 days or more past due, as well as loans in nonaccrual status.
(Dollars in thousands)
Aggregate
Fair Value
December 31, 2009
Aggregate Unpaid
Principal
Balance under FVO
December 31, 2009
Fair value
over/(under)
unpaid principal
Trading assets $286,544 $261,693 $24,851
Loans 397,764 453,751 (55,987)
Past due loans of 90 days or more 4,697 8,358 (3,661)
Nonaccrual loans 46,259 83,396 (37,137)
Loans held for sale 2,889,111 2,874,578 14,533
Past due loans of 90 days or more 3,288 4,929 (1,641)
Nonaccrual loans 30,976 52,019 (21,043)
Brokered deposits 1,260,505 1,319,901 (59,396)
Long-term debt 3,585,892 3,613,085 (27,193)
(Dollars in thousands)
Aggregate
Fair Value
December 31, 2008
Aggregate
Unpaid Principal
Balance under FVO
December 31, 2008
Fair value
over/(under)
unpaid principal
Trading assets $852,300 $861,239 ($8,939)
Loans 222,221 247,098 (24,877)
Past due loans of 90 days or more 2,018 2,906 (888)
Nonaccrual loans 46,103 81,618 (35,515)
Loans held for sale 2,392,286 2,408,392 (16,106)
Past due loans of 90 days or more 4,663 7,222 (2,559)
Nonaccrual loans 27,483 47,228 (19,745)
Brokered deposits 587,486 627,737 (40,251)
Long-term debt 7,155,684 6,963,085 192,599
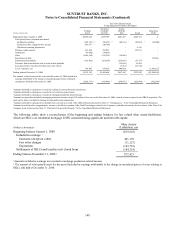
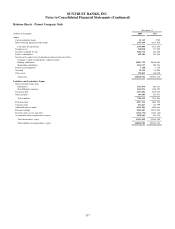
Fair Value of Financial Instruments
The carrying amounts and fair values of the Company’s financial instruments at December 31 were as follows:
2009 2008
(Dollars in thousands)
Carrying
Amount Fair Value
Carrying
Amount Fair Value
Financial assets
Cash and cash equivalents $6,997,171 $6,997,171 (a) $6,637,402 $6,637,402 (a)
Trading assets 4,979,938 4,979,938 (b) 10,396,269 10,396,269 (b)
Securities available for sale 28,477,042 28,477,042 (b) 19,696,537 19,696,537 (b)
Loans held for sale 4,669,823 4,681,915 (c) 4,032,128 4,032,128 (c)
Total loans 113,674,844 113,674,844 126,998,443 126,998,443
Interest/credit adjustment (3,120,000) (4,121,806) (2,350,996) (4,369,121)
Subtotal 110,554,844 109,553,038 (d) 124,647,447 122,629,322 (d)
Market risk/liquidity adjustment - (7,815,567) - (11,731,290)
Loans, net $110,554,844 $101,737,471 (d) $124,647,447 $110,898,032 (d)
Financial liabilities
Consumer and commercial deposits $116,303,452 $116,607,808 (e) $105,275,707 $105,770,657 (e)
Brokered deposits 4,231,530 4,160,835 (f) 7,667,167 7,586,427 (f)
Foreign deposits 1,328,584 1,328,584 (f) 385,510 385,510 (f)
Short-term borrowings 5,365,368 5,355,625 (f) 9,479,750 9,479,750 (f)
Long-term debt 17,489,516 16,701,653 (f) 26,812,381 25,878,644 (f)
Trading liabilities 2,188,923 2,188,923 (b) 3,240,784 3,240,784 (b)
149