SunTrust 2009 Annual Report Download - page 146
Download and view the complete annual report
Please find page 146 of the 2009 SunTrust annual report below. You can navigate through the pages in the report by either clicking on the pages listed below, or by using the keyword search tool below to find specific information within the annual report.-
 1
1 -
2
-
3
-
4
-
5
-
6
-
7
-
8
-
9
-
10
-
11
-
12
-
13
-
14
-
15
-
16
-
17
-
18
-
19
-
20
-
21
-
22
-
23
-
24
-
25
-
26
-
27
-
28
-
29
-
30
-
31
-
32
-
33
-
34
-
35
-
36
-
37
-
38
-
39
-
40
-
41
-
42
-
43
-
44
-
45
-
46
-
47
-
48
-
49
-
50
-
51
-
52
-
53
-
54
-
55
-
56
-
57
-
58
-
59
-
60
-
61
-
62
-
63
-
64
-
65
-
66
-
67
-
68
-
69
-
70
-
71
-
72
-
73
-
74
-
75
-
76
-
77
-
78
-
79
-
80
-
81
-
82
-
83
-
84
-
85
-
86
-
87
-
88
-
89
-
90
-
91
-
92
-
93
-
94
-
95
-
96
-
97
-
98
-
99
-
100
-
101
-
102
-
103
-
104
-
105
-
106
-
107
-
108
-
109
-
110
-
111
-
112
-
113
-
114
-
115
-
116
-
117
-
118
-
119
-
120
-
121
-
122
-
123
-
124
-
125
-
126
-
127
-
128
-
129
-
130
-
131
-
132
-
133
-
134
-
135
-
 136
136 -
 137
137 -
 138
138 -
 139
139 -
 140
140 -
 141
141 -
 142
142 -
 143
143 -
 144
144 -
 145
145 -
 146
146 -
 147
147 -
 148
148 -
 149
149 -
 150
150 -
 151
151 -
 152
152 -
 153
153 -
 154
154 -
 155
155 -
 156
156 -
157
-
158
-
159
-
160
-
161
-
162
-
163
-
164
-
165
-
166
-
167
-
168
-
169
-
170
-
171
-
172
-
173
-
174
-
175
-
176
-
177
-
178
-
179
-
180
-
181
-
182
-
183
-
184
-
185
-
186
 |
 |

SUNTRUST BANKS, INC.
Notes to Consolidated Financial Statements (Continued)
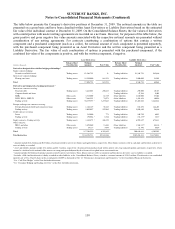
The table below presents the Company’s derivative positions at December 31, 2009. The notional amounts in the table are
presented on a gross basis and have been classified within Asset Derivatives or Liability Derivatives based on the estimated
fair value of the individual contract at December 31, 2009. On the Consolidated Balance Sheets, the fair values of derivatives
with counterparties with master netting agreements are recorded on a net basis. However, for purposes of the table below, the
gross positive and gross negative fair value amounts associated with the respective notional amounts are presented without
consideration of any netting agreements. For contracts constituting a combination of options that contain a written
component and a purchased component (such as a collar), the notional amount of each component is presented separately,
with the purchased component being presented as an Asset Derivative and the written component being presented as a
Liability Derivative. The fair value of each combination of options is presented with the purchased component, if the
combined fair value of the components is positive, and with the written component, if negative.
Asset Derivatives Liability Derivatives
(Dollars in thousands)
Balance Sheet
Classification
Notional
Amounts Fair Value
Balance Sheet
Classification
Notional
Amounts Fair Value
Derivatives designated in cash flow hedging relationships 5
Equity contracts hedging:
Securities available for sale Trading assets $1,546,752 $- Trading liabilities $1,546,752 $45,866
Interest rate contracts hedging:
Floating rate loans Trading assets 15,550,000 865,391 Trading liabilities 3,000,000 22,202
Total 17,096,752 865,391 4,546,752 68,068
Derivatives not designated as hedging instruments 6
Interest rate contracts covering:
Fixed rate debt Trading assets 3,223,085 200,183 Trading liabilities 295,000 10,335
Corporate bonds and loans - - Trading liabilities 47,568 4,002
MSRs Other assets 3,715,000 61,719 Other liabilities 3,810,000 57,048
LHFS, IRLCs, LHFI-FV Other assets 7,461,935 375,071 Other liabilities 1,425,858 20,056
Trading activity Trading assets 94,139,597 13,289,667 Trading liabilities 83,483,088 3,242,861
Foreign exchange rate contracts covering:
Foreign-denominated debt and commercial loans Trading assets 1,164,169 96,143 Trading liabilities 656,498 144,203
Trading activity Trading assets 2,059,097 107,065 Trading liabilities 2,020,240 96,266
Credit contracts covering:
Loans Trading assets 115,000 771 Trading liabilities 240,750 4,051
Trading activity Trading assets 170,044 26,344 Trading liabilities 156,139 23,837
Equity contracts - Trading activity Trading assets 3,344,875 1446,355 Trading liabilities 6,907,657 672,221
Other contracts:
IRLCs and other Other assets 1,870,040 13,482 Other liabilities 1,560,337 448,134 4
Trading activity Trading assets 39,117 7,095 Trading liabilities 51,546 6,929
Total 117,301,959 4,303,895 100,654,681 4,309,943
Total derivatives $134,398,711 $5,169,286 $105,201,433 $4,378,011
1Amounts include $18.2 billion and $0.5 billion of notional related to interest rate futures and equity futures, respectively. These futures contracts settle in cash daily and therefore no derivative
asset or liability is recorded.
2Asset and liability amounts include $3.6 million and $8.7 million, respectively, of notional from purchased and written interest rate swap risk participation agreements, respectively, which
notional is calculated as the notional of the interest rate swap participated adjusted by the relevant risk weighted assets conversion factor.
3Amount includes $2.0 billion of notional amounts related to interest rate futures. These futures contracts settle in cash daily and therefore no derivative asset or liability is recorded.
4Includes a $40.4 million derivative liability recorded in other liabilities in the Consolidated Balance Sheets, related to a notional amount of $134.3 million. This derivative was established
upon the sale of Visa Class B shares in the second quarter of 2009 as discussed in Note 18, “Reinsurance Arrangements and Guarantees,” to the Consolidated Financial Statements.
5See “Cash Flow Hedges” in this Note for further discussion.
6See “Economic Hedging and Trading Activities” in this Note for further discussion.
130