SunTrust 2009 Annual Report Download - page 159
Download and view the complete annual report
Please find page 159 of the 2009 SunTrust annual report below. You can navigate through the pages in the report by either clicking on the pages listed below, or by using the keyword search tool below to find specific information within the annual report.-
 1
1 -
2
-
3
-
4
-
5
-
6
-
7
-
8
-
9
-
10
-
11
-
12
-
13
-
14
-
15
-
16
-
17
-
18
-
19
-
20
-
21
-
22
-
23
-
24
-
25
-
26
-
27
-
28
-
29
-
30
-
31
-
32
-
33
-
34
-
35
-
36
-
37
-
38
-
39
-
40
-
41
-
42
-
43
-
44
-
45
-
46
-
47
-
48
-
49
-
50
-
51
-
52
-
53
-
54
-
55
-
56
-
57
-
58
-
59
-
60
-
61
-
62
-
63
-
64
-
65
-
66
-
67
-
68
-
69
-
70
-
71
-
72
-
73
-
74
-
75
-
76
-
77
-
78
-
79
-
80
-
81
-
82
-
83
-
84
-
85
-
86
-
87
-
88
-
89
-
90
-
91
-
92
-
93
-
94
-
95
-
96
-
97
-
98
-
99
-
100
-
101
-
102
-
103
-
104
-
105
-
106
-
107
-
108
-
109
-
110
-
111
-
112
-
113
-
114
-
115
-
116
-
117
-
118
-
119
-
120
-
121
-
122
-
123
-
124
-
125
-
126
-
127
-
128
-
129
-
130
-
131
-
132
-
133
-
134
-
135
-
136
-
137
-
138
-
139
-
140
-
141
-
142
-
143
-
144
-
145
-
146
-
147
-
148
-
 149
149 -
 150
150 -
 151
151 -
 152
152 -
 153
153 -
 154
154 -
 155
155 -
 156
156 -
 157
157 -
 158
158 -
 159
159 -
 160
160 -
 161
161 -
 162
162 -
 163
163 -
 164
164 -
 165
165 -
 166
166 -
 167
167 -
 168
168 -
 169
169 -
170
-
171
-
172
-
173
-
174
-
175
-
176
-
177
-
178
-
179
-
180
-
181
-
182
-
183
-
184
-
185
-
186
 |
 |

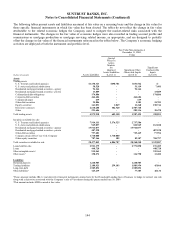
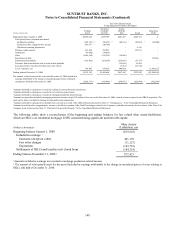
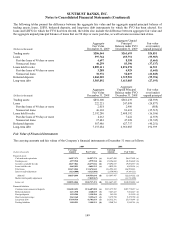
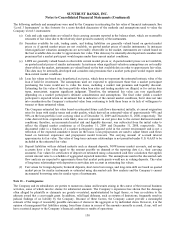
SUNTRUST BANKS, INC.
Notes to Consolidated Financial Statements (Continued)
Certain level 3 assets include non-financial assets such as affordable housing properties, private equity investments, and
intangible assets that are measured on a non-recurring basis based on third party price indications or the estimated
expected remaining cash flows to be received from these assets discounted at a market rate that is commensurate with
their risk profile.
A portion of the Company’s OREO portfolio resides in level 3 due to the lack of observable market data available for
vacant developed lots and land. The Company utilized a pooled valuation approach to value the vacant developed lots
and land and estimated the percentage decline that has taken place in these property types on a per state basis. As a
result of the valuation analysis performed in assessing market value deterioration by state, the Company recorded an
allowance of $46.4 million for the vacant developed lots and land totaling $123.8 million in net carrying value. These
vacant developed lots and land are located primarily in Georgia and North Carolina.
Credit Risk
The credit risk associated with the underlying cash flows of an instrument carried at fair value was a consideration in
estimating the fair value of certain financial instruments. Credit risk was considered in the valuation through a variety of
inputs, as applicable, including, the actual default and loss severity of the collateral, the instrument’s spread in relation
to U.S. Treasury rates, the capital structure of the security and level of subordination, and/or the rating on a security/
obligor as defined by nationally recognized rating agencies. The assumptions used to estimate credit risk applied
relevant information that a market participant would likely use in valuing an instrument.
For loan products that the Company has elected to carry at fair value, the Company has considered the component of the
fair value changes due to instrument-specific credit risk, which is intended to be an approximation of the fair value
change attributable to changes in borrower-specific credit risk. For the year ended December 31, 2009, SunTrust
recognized a loss on loans accounted for at fair value of approximately $24.1 million, due to changes in fair value
attributable to borrower-specific credit risk. For the year ended December 31, 2008, SunTrust recognized a loss on loans
accounted for at fair value of approximately $46.6 million, due to changes in fair value attributable to borrower-specific
credit risk. In addition to borrower-specific credit risk, there are other, more significant variables that will drive changes
in the fair value of the loans, including interest rates changes and general conditions in the principal markets for the
loans.
For the publicly-traded fixed rate debt and brokered deposits carried at fair value, the Company estimated credit spreads
above U.S. Treasury rates and LIBOR, respectively, based on credit spreads from actual or estimated trading levels of
the debt, or other relevant market data. Prior to the second quarter of 2008, the Company had estimated the impacts of
its own credit spreads over LIBOR for its public debt; however, given the volatility in the interest rate markets during
2008, the Company analyzed the difference between using U.S. Treasury rates and LIBOR. While the historical analysis
indicated only minor differences, the Company believes that beginning in the second quarter of 2008 a more accurate
depiction of the impacts of changes in its own credit spreads on its public debt is to base such estimation on the U.S.
Treasury rate, which reflects a risk-free interest rate. A reason the Company had selected LIBOR in the past was due to
the presence of LIBOR-based interest rate swap contracts that the Company had historically used to hedge its interest
rate exposure on these debt instruments. The Company may, however, also purchase fixed rate trading securities in an
effort to hedge its fair value exposure to its fixed rate debt. The Company may also continue to use interest rate swap
contracts to hedge interest exposure on future fixed rate debt issuances. The Company continues to use LIBOR as the
basis for estimating credit spreads on its brokered deposits, due to differences in terms, principal markets, and other
factors. The Company recognized a loss of approximately $235.3 million for the year ended December 31, 2009, and a
gain of approximately $398.1 million for the year ended December 31, 2008, due to changes in its own credit spread on
its public debt and brokered deposits.
143