SunTrust 2009 Annual Report Download - page 170
Download and view the complete annual report
Please find page 170 of the 2009 SunTrust annual report below. You can navigate through the pages in the report by either clicking on the pages listed below, or by using the keyword search tool below to find specific information within the annual report.-
 1
1 -
2
-
3
-
4
-
5
-
6
-
7
-
8
-
9
-
10
-
11
-
12
-
13
-
14
-
15
-
16
-
17
-
18
-
19
-
20
-
21
-
22
-
23
-
24
-
25
-
26
-
27
-
28
-
29
-
30
-
31
-
32
-
33
-
34
-
35
-
36
-
37
-
38
-
39
-
40
-
41
-
42
-
43
-
44
-
45
-
46
-
47
-
48
-
49
-
50
-
51
-
52
-
53
-
54
-
55
-
56
-
57
-
58
-
59
-
60
-
61
-
62
-
63
-
64
-
65
-
66
-
67
-
68
-
69
-
70
-
71
-
72
-
73
-
74
-
75
-
76
-
77
-
78
-
79
-
80
-
81
-
82
-
83
-
84
-
85
-
86
-
87
-
88
-
89
-
90
-
91
-
92
-
93
-
94
-
95
-
96
-
97
-
98
-
99
-
100
-
101
-
102
-
103
-
104
-
105
-
106
-
107
-
108
-
109
-
110
-
111
-
112
-
113
-
114
-
115
-
116
-
117
-
118
-
119
-
120
-
121
-
122
-
123
-
124
-
125
-
126
-
127
-
128
-
129
-
130
-
131
-
132
-
133
-
134
-
135
-
136
-
137
-
138
-
139
-
140
-
141
-
142
-
143
-
144
-
145
-
146
-
147
-
148
-
149
-
150
-
151
-
152
-
153
-
154
-
155
-
156
-
157
-
158
-
159
-
 160
160 -
 161
161 -
 162
162 -
 163
163 -
 164
164 -
 165
165 -
 166
166 -
 167
167 -
 168
168 -
 169
169 -
 170
170 -
 171
171 -
 172
172 -
 173
173 -
 174
174 -
 175
175 -
 176
176 -
 177
177 -
 178
178 -
 179
179 -
 180
180 -
181
-
182
-
183
-
184
-
185
-
186
 |
 |

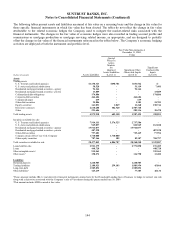
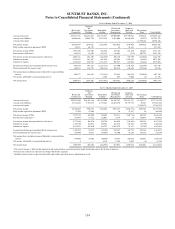
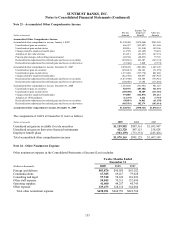
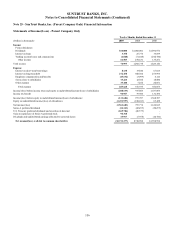
SUNTRUST BANKS, INC.
Notes to Consolidated Financial Statements (Continued)
Twelve Months Ended December 31, 2008
Retail and
Commercial
Corporate
and
Investment
Banking
Household
Lending
Wealth and
Investment
Management
Corporate
Other and
Treasury
Reconciling
Items Consolidated
Average total assets $58,337,176 $32,254,013 $56,333,437 $9,009,009 $19,745,012 $169,618 $175,848,265
Average total liabilities 86,620,846 15,042,794 2,832,518 9,981,004 42,842,054 (67,237) 157,251,979
Average total equity - - - - - 18,596,286 18,596,286
Net interest income $2,559,079 $274,821 $726,850 $325,076 $146,968 $586,862 $4,619,656
Fully taxable-equivalent adjustment (FTE) 34,511 64,719 - 29 18,227 1 117,487
Net interest income (FTE)12,593,590 339,540 726,850 325,105 165,195 586,863 4,737,143
Provision for credit losses2589,879 55,250 893,139 26,895 (735) 909,787 2,474,215
Net interest income after provision for credit losses 2,003,711 284,290 (166,289) 298,210 165,930 (322,924) 2,262,928
Noninterest income 1,392,267 561,807 481,290 949,103 1,103,243 (14,247) 4,473,463
Noninterest expense 2,730,344 540,910 1,531,178 969,813 121,004 (14,226) 5,879,023
Income/(loss) before provision/(benefit) for income taxes 665,634 305,187 (1,216,177) 277,500 1,148,169 (322,945) 857,368
Provision/(benefit) for income taxes3160,657 116,759 (480,216) 102,259 278,643 (127,886) 50,216
Net income/(loss) including income attributable to noncontrolling
interest 504,977 188,428 (735,961) 175,241 869,526 (195,059) 807,152
Net income attributable to noncontrolling interest 2 - 1,530 849 9,000 (3) 11,378
Net income/(loss) $504,975 $188,428 ($737,491) $174,392 $860,526 ($195,056) $795,774
Twelve Months Ended December 31, 2007
Retail and
Commercial
Corporate
and
Investment
Banking
Household
Lending
Wealth and
Investment
Management
Corporate
Other and
Treasury
Reconciling
Items Consolidated
Average total assets $59,033,586 $25,051,326 $59,413,905 $8,898,787 $23,815,137 $1,582,777 $177,795,518
Average total liabilities 87,254,458 9,555,275 2,773,461 10,429,670 49,757,933 96,347 159,867,144
Average total equity - - - - - 17,928,374 17,928,374
Net interest income $2,902,467 $196,391 $742,801 $355,157 ($166,573) $689,301 $4,719,544
Fully taxable-equivalent adjustment (FTE) 37,252 47,509 - 54 17,837 28 102,680
Net interest income (FTE)12,939,719 243,900 742,801 355,211 (148,736) 689,329 4,822,224
Provision for credit losses2164,471 37,722 212,067 8,519 65 242,078 664,922
Net interest income after provision for credit losses 2,775,248 206,178 530,734 346,692 (148,801) 447,251 4,157,302
Noninterest income 1,310,730 382,031 398,961 812,874 547,883 (23,795) 3,428,684
Noninterest expense 2,697,027 495,630 981,797 1,016,979 53,327 (23,707) 5,221,053
Income/(loss) before provision/(benefit) for income taxes 1,388,951 92,579 (52,102) 142,587 345,755 447,163 2,364,933
Provision/(benefit) for income taxes3429,948 34,277 (41,458) 54,100 86,199 155,128 718,194
Net income/(loss) including income attributable to noncontrolling
interest 959,003 58,302 (10,644) 88,487 259,556 292,035 1,646,739
Net income attributable to noncontrolling interest 4 - 2,330 1,394 9,002 (6) 12,724
Net income/(loss) $958,999 $58,302 ($12,974) $87,093 $250,554 $292,041 $1,634,015
1Net interest income is fully taxable-equivalent and is presented on a matched maturity funds transfer price basis for the line of business.
2Provision for credit losses represents net charge-offs for the segments.
3Includes regular income tax provision/(benefit) and taxable-equivalent income adjustment reversal.
154