SunTrust 2009 Annual Report Download - page 40
Download and view the complete annual report
Please find page 40 of the 2009 SunTrust annual report below. You can navigate through the pages in the report by either clicking on the pages listed below, or by using the keyword search tool below to find specific information within the annual report.-
 1
1 -
2
-
3
-
4
-
5
-
6
-
7
-
8
-
9
-
10
-
11
-
12
-
13
-
14
-
15
-
16
-
17
-
18
-
19
-
20
-
21
-
22
-
23
-
24
-
25
-
26
-
27
-
28
-
29
-
 30
30 -
 31
31 -
 32
32 -
 33
33 -
 34
34 -
 35
35 -
 36
36 -
 37
37 -
 38
38 -
 39
39 -
 40
40 -
 41
41 -
 42
42 -
 43
43 -
 44
44 -
 45
45 -
 46
46 -
 47
47 -
 48
48 -
 49
49 -
 50
50 -
51
-
52
-
53
-
54
-
55
-
56
-
57
-
58
-
59
-
60
-
61
-
62
-
63
-
64
-
65
-
66
-
67
-
68
-
69
-
70
-
71
-
72
-
73
-
74
-
75
-
76
-
77
-
78
-
79
-
80
-
81
-
82
-
83
-
84
-
85
-
86
-
87
-
88
-
89
-
90
-
91
-
92
-
93
-
94
-
95
-
96
-
97
-
98
-
99
-
100
-
101
-
102
-
103
-
104
-
105
-
106
-
107
-
108
-
109
-
110
-
111
-
112
-
113
-
114
-
115
-
116
-
117
-
118
-
119
-
120
-
121
-
122
-
123
-
124
-
125
-
126
-
127
-
128
-
129
-
130
-
131
-
132
-
133
-
134
-
135
-
136
-
137
-
138
-
139
-
140
-
141
-
142
-
143
-
144
-
145
-
146
-
147
-
148
-
149
-
150
-
151
-
152
-
153
-
154
-
155
-
156
-
157
-
158
-
159
-
160
-
161
-
162
-
163
-
164
-
165
-
166
-
167
-
168
-
169
-
170
-
171
-
172
-
173
-
174
-
175
-
176
-
177
-
178
-
179
-
180
-
181
-
182
-
183
-
184
-
185
-
186
 |
 |
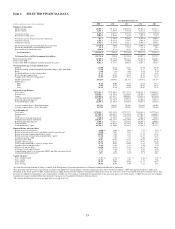
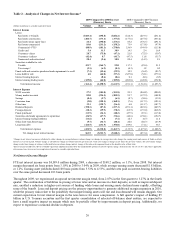
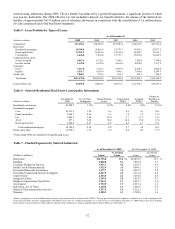
We increased our securities available for sale holdings during the year, resulting in a 44.6% increase in the year end balance
compared to prior year end. This increase was led by the increase in our holdings of U.S. Treasury and agency securities by
over $7 billion in light of the increased liquidity from higher deposits and lower loan balances. In addition, agency MBS
increased by over $1 billion. This increase was related to sales during the year where we had the opportunity to manage the
portfolio’s duration by selling bonds at a gain and repositioning the MBS portfolio into securities that we believe have higher
relative value. As a result of the securities sales, we realized $98.0 million in net gains during the year.
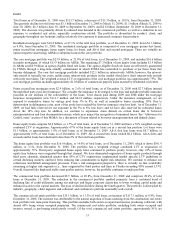
FTE net interest income was $4.6 billion for the year ended December 31, 2009, compared to $4.7 billion for the year ended
December 31, 2008. FTE total revenue was down 9.9% to $8.3 billion for the year ended December 31, 2009 as a result of
soft revenue generation in certain areas and substantially lower securities gains compared to the prior year. Net interest
margin in 2009 decreased six basis points when compared to the prior year primarily as a result of decreased loan pricing that
outpaced the decreased deposit pricing during the year. Total noninterest expense increased by $683.4 million, or 11.6%, in
2009, primarily driven by the $751.2 million non-cash goodwill impairment charge recognized during the year. Provision for
credit losses was $4.1 billion for the year ended 2009, an increase of $1.6 billion from the prior year. The provision for loan
losses was $769.0 million higher than net charge-offs of $3.2 billion for the year. The ALLL increased $769.0 million, or
32.7%, from December 31, 2008 and was 2.76% of total loans not carried at fair value compared to 1.86% as of
December 31, 2008. Net charge-offs to average loans were 2.67% for the year ended 2009 compared to 1.25% for 2008.
Nonperforming assets rose during the year to $6.1 billion at year end compared to $4.5 billion at the end of last year. The
average shareholders’ equity to average total assets ratio and the tangible equity to tangible assets ratio both improved from
10.58% and 8.46% at December 31, 2008 to 12.70% and 9.66%, respectively, at December 31, 2009. We recorded $265.8
million in dividends and accretion during 2009 related to preferred stock issued to the U.S. Treasury under the CPP
compared to $26.6 million during 2008. See additional discussion of our financial performance in the “Consolidated
Financial Results” section of this MD&A.
24