SunTrust 2009 Annual Report Download - page 172
Download and view the complete annual report
Please find page 172 of the 2009 SunTrust annual report below. You can navigate through the pages in the report by either clicking on the pages listed below, or by using the keyword search tool below to find specific information within the annual report.-
 1
1 -
 2
2 -
 3
3 -
 4
4 -
 5
5 -
 6
6 -
 7
7 -
 8
8 -
 9
9 -
 10
10 -
 11
11 -
 12
12 -
 13
13 -
 14
14 -
 15
15 -
 16
16 -
 17
17 -
 18
18 -
 19
19 -
 20
20 -
 21
21 -
 22
22 -
 23
23 -
 24
24 -
 25
25 -
 26
26 -
 27
27 -
 28
28 -
 29
29 -
 30
30 -
 31
31 -
 32
32 -
 33
33 -
 34
34 -
 35
35 -
 36
36 -
 37
37 -
 38
38 -
 39
39 -
 40
40 -
 41
41 -
 42
42 -
 43
43 -
 44
44 -
 45
45 -
 46
46 -
 47
47 -
 48
48 -
 49
49 -
 50
50 -
 51
51 -
 52
52 -
 53
53 -
 54
54 -
 55
55 -
 56
56 -
 57
57 -
 58
58 -
 59
59 -
 60
60 -
 61
61 -
 62
62 -
 63
63 -
 64
64 -
 65
65 -
 66
66 -
 67
67 -
 68
68 -
 69
69 -
 70
70 -
 71
71 -
 72
72 -
 73
73 -
 74
74 -
 75
75 -
 76
76 -
 77
77 -
 78
78 -
 79
79 -
 80
80 -
 81
81 -
 82
82 -
 83
83 -
 84
84 -
 85
85 -
 86
86 -
 87
87 -
 88
88 -
 89
89 -
 90
90 -
 91
91 -
 92
92 -
 93
93 -
 94
94 -
 95
95 -
 96
96 -
 97
97 -
 98
98 -
 99
99 -
 100
100 -
 101
101 -
 102
102 -
 103
103 -
 104
104 -
 105
105 -
 106
106 -
 107
107 -
 108
108 -
 109
109 -
 110
110 -
 111
111 -
 112
112 -
 113
113 -
 114
114 -
 115
115 -
 116
116 -
 117
117 -
 118
118 -
 119
119 -
 120
120 -
 121
121 -
 122
122 -
 123
123 -
 124
124 -
 125
125 -
 126
126 -
 127
127 -
 128
128 -
 129
129 -
 130
130 -
 131
131 -
 132
132 -
 133
133 -
 134
134 -
 135
135 -
 136
136 -
 137
137 -
 138
138 -
 139
139 -
 140
140 -
 141
141 -
 142
142 -
 143
143 -
 144
144 -
 145
145 -
 146
146 -
 147
147 -
 148
148 -
 149
149 -
 150
150 -
 151
151 -
 152
152 -
 153
153 -
 154
154 -
 155
155 -
 156
156 -
 157
157 -
 158
158 -
 159
159 -
 160
160 -
 161
161 -
 162
162 -
 163
163 -
 164
164 -
 165
165 -
 166
166 -
 167
167 -
 168
168 -
 169
169 -
 170
170 -
 171
171 -
 172
172 -
 173
173 -
 174
174 -
 175
175 -
 176
176 -
 177
177 -
 178
178 -
 179
179 -
 180
180 -
 181
181 -
 182
182 -
 183
183 -
 184
184 -
 185
185 -
 186
186
 |
 |

SUNTRUST BANKS, INC.
Notes to Consolidated Financial Statements (Continued)
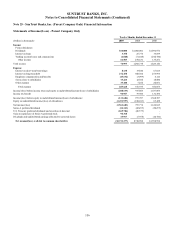
Note 25 - SunTrust Banks, Inc. (Parent Company Only) Financial Information
Statements of Income/(Loss) - Parent Company Only
Twelve Months Ended December 31
(Dollars in thousands) 2009 2008 2007
Income
From subsidiaries:
Dividends $14,000 $1,068,001 $1,896,976
Interest on loans 3,358 25,754 33,699
Trading account losses and commissions (1,868) (71,648) (242,780)
Other income 61,505 270,631 135,251
Total income 76,995 1,292,738 1,823,146
Expense
Interest on short-term borrowings 8,138 33,840 67,013
Interest on long-term debt 272,458 308,560 273,993
Employee compensation and benefits (45,632) (3,099) 4,116
Service fees to subsidiaries 15,224 12,382 18,880
Other expense 35,440 5,252 22,051
Total expense 285,628 356,935 386,053
Income/(loss) before income taxes and equity in undistributed income/(loss) of subsidiaries (208,633) 935,803 1,437,093
Income tax benefit 96,947 39,984 131,494
Income/(loss) before equity in undistributed income/(loss) of subsidiaries (111,686) 975,787 1,568,587
Equity in undistributed income/(loss) of subsidiaries (1,451,997) (180,013) 65,428
Net income/(loss) (1,563,683) 795,774 1,634,015
Series A preferred dividends (14,143) (22,255) (30,275)
U.S. Treasury preferred dividends and accretion of discount (265,786) (26,579) -
Gain on repurchase of Series A preferred stock 94,318 --
Dividends and undistributed earnings allocated to unvested shares 15,917 (5,958) (10,786)
Net income/(loss) available to common shareholders ($1,733,377) $740,982 $1,592,954
156
