SunTrust 2009 Annual Report Download - page 116
Download and view the complete annual report
Please find page 116 of the 2009 SunTrust annual report below. You can navigate through the pages in the report by either clicking on the pages listed below, or by using the keyword search tool below to find specific information within the annual report.-
 1
1 -
2
-
3
-
4
-
5
-
6
-
7
-
8
-
9
-
10
-
11
-
12
-
13
-
14
-
15
-
16
-
17
-
18
-
19
-
20
-
21
-
22
-
23
-
24
-
25
-
26
-
27
-
28
-
29
-
30
-
31
-
32
-
33
-
34
-
35
-
36
-
37
-
38
-
39
-
40
-
41
-
42
-
43
-
44
-
45
-
46
-
47
-
48
-
49
-
50
-
51
-
52
-
53
-
54
-
55
-
56
-
57
-
58
-
59
-
60
-
61
-
62
-
63
-
64
-
65
-
66
-
67
-
68
-
69
-
70
-
71
-
72
-
73
-
74
-
75
-
76
-
77
-
78
-
79
-
80
-
81
-
82
-
83
-
84
-
85
-
86
-
87
-
88
-
89
-
90
-
91
-
92
-
93
-
94
-
95
-
96
-
97
-
98
-
99
-
100
-
101
-
102
-
103
-
104
-
105
-
 106
106 -
 107
107 -
 108
108 -
 109
109 -
 110
110 -
 111
111 -
 112
112 -
 113
113 -
 114
114 -
 115
115 -
 116
116 -
 117
117 -
 118
118 -
 119
119 -
 120
120 -
 121
121 -
 122
122 -
 123
123 -
 124
124 -
 125
125 -
 126
126 -
127
-
128
-
129
-
130
-
131
-
132
-
133
-
134
-
135
-
136
-
137
-
138
-
139
-
140
-
141
-
142
-
143
-
144
-
145
-
146
-
147
-
148
-
149
-
150
-
151
-
152
-
153
-
154
-
155
-
156
-
157
-
158
-
159
-
160
-
161
-
162
-
163
-
164
-
165
-
166
-
167
-
168
-
169
-
170
-
171
-
172
-
173
-
174
-
175
-
176
-
177
-
178
-
179
-
180
-
181
-
182
-
183
-
184
-
185
-
186
 |
 |

SUNTRUST BANKS, INC.
Notes to Consolidated Financial Statements (Continued)
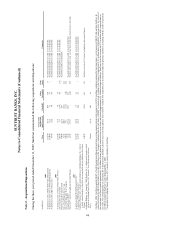
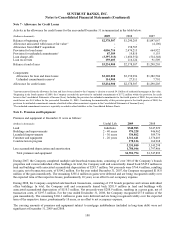
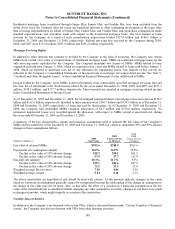
Note 7 - Allowance for Credit Losses
Activity in the allowance for credit losses for the year ended December 31 is summarized in the table below:
(Dollars in thousands) 2009 2008 2007
Balance at beginning of year $2,378,507 $1,290,205 $1,047,067
Allowance associated with loans at fair value 1-- (4,100)
Allowance from GB&T acquisition -158,705 -
Provision for loan losses 4,006,714 2,474,215 664,922
Provision for unfunded commitments287,389 19,810 5,155
Loan charge-offs (3,397,313) (1,680,552) (514,348)
Loan recoveries 159,603 116,124 91,509
Balance at end of year $3,234,900 $2,378,507 $1,290,205
Components:
Allowance for loan and lease losses $3,120,000 $2,350,996 $1,282,504
Unfunded commitments reserve3114,900 27,511 7,701
Allowance for credit losses $3,234,900 $2,378,507 $1,290,205
1Amount removed from the allowance for loan and lease losses related to the Company’s election to record $4.1 billion of residential mortgages at fair value.
2Beginning in the fourth quarter of 2009, the Company recorded the provision for unfunded commitments of $57.2 million within the provision for credit
losses in the Consolidated Statements of Income/(Loss). Including the provision for unfunded commitments for the fourth quarter of 2009, the provision for
credit losses was $4.1 billion for the year ended December 31, 2009. Considering the immateriality of this provision prior to the fourth quarter of 2009, the
provision for unfunded commitments remains classified within other noninterest expense in the Consolidated Statements of Income/(Loss).
3The unfunded commitments reserve is separately recorded in other liabilities in the Consolidated Balance Sheets.
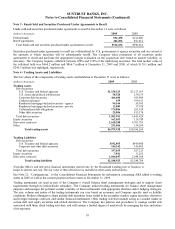
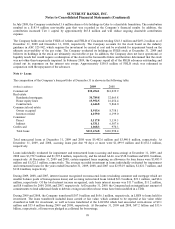
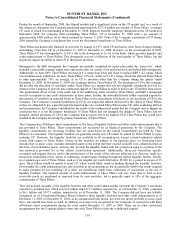
Note 8 - Premises and Equipment
Premises and equipment at December 31 were as follows:
(Dollars in thousands) Useful Life 2009 2008
Land Indefinite $340,983 $347,229
Buildings and improvements 2 - 40 years 974,228 946,962
Leasehold improvements 1 - 30 years 534,862 509,736
Furniture and equipment 1 - 20 years 1,311,641 1,376,403
Construction in progress 170,126 164,968
3,331,840 3,345,298
Less accumulated depreciation and amortization 1,780,046 1,797,406
Total premises and equipment $1,551,794 $1,547,892
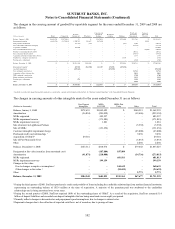
During 2007, the Company completed multiple sale/leaseback transactions, consisting of over 300 of the Company’s branch
properties and various individual office buildings. In total, the Company sold and concurrently leased back $545.9 million in
land and buildings with associated accumulated depreciation of $285.7 million. Net proceeds were $764.4 million, resulting
in a gain, net of transaction costs, of $504.2 million. For the year ended December 31, 2007, the Company recognized $118.8
million of the gain immediately. The remaining $385.4 million in gains were deferred and are being recognized ratably over
the expected term of the respective leases, predominantly 10 years, as an offset to net occupancy expense.
During 2008, the Company completed sale/leaseback transactions, consisting of 152 branch properties and various individual
office buildings. In total, the Company sold and concurrently leased back $201.9 million in land and buildings with
associated accumulated depreciation of $110.3 million. Net proceeds were $288.9 million, resulting in a gross gain, net of
transaction costs, of $197.3 million. For the year ended December 31, 2008, the Company recognized $37.0 million of the
gain immediately. The remaining $160.3 million in gains were deferred and are being recognized ratably over the expected
term of the respective leases, predominantly 10 years, as an offset to net occupancy expense.
The carrying amounts of premises and equipment subject to mortgage indebtedness (included in long-term debt) were not
significant at December 31, 2009 and 2008.
100