SunTrust 2009 Annual Report Download - page 48
Download and view the complete annual report
Please find page 48 of the 2009 SunTrust annual report below. You can navigate through the pages in the report by either clicking on the pages listed below, or by using the keyword search tool below to find specific information within the annual report.-
 1
1 -
2
-
3
-
4
-
5
-
6
-
7
-
8
-
9
-
10
-
11
-
12
-
13
-
14
-
15
-
16
-
17
-
18
-
19
-
20
-
21
-
22
-
23
-
24
-
25
-
26
-
27
-
28
-
29
-
30
-
31
-
32
-
33
-
34
-
35
-
36
-
37
-
 38
38 -
 39
39 -
 40
40 -
 41
41 -
 42
42 -
 43
43 -
 44
44 -
 45
45 -
 46
46 -
 47
47 -
 48
48 -
 49
49 -
 50
50 -
 51
51 -
 52
52 -
 53
53 -
 54
54 -
 55
55 -
 56
56 -
 57
57 -
 58
58 -
59
-
60
-
61
-
62
-
63
-
64
-
65
-
66
-
67
-
68
-
69
-
70
-
71
-
72
-
73
-
74
-
75
-
76
-
77
-
78
-
79
-
80
-
81
-
82
-
83
-
84
-
85
-
86
-
87
-
88
-
89
-
90
-
91
-
92
-
93
-
94
-
95
-
96
-
97
-
98
-
99
-
100
-
101
-
102
-
103
-
104
-
105
-
106
-
107
-
108
-
109
-
110
-
111
-
112
-
113
-
114
-
115
-
116
-
117
-
118
-
119
-
120
-
121
-
122
-
123
-
124
-
125
-
126
-
127
-
128
-
129
-
130
-
131
-
132
-
133
-
134
-
135
-
136
-
137
-
138
-
139
-
140
-
141
-
142
-
143
-
144
-
145
-
146
-
147
-
148
-
149
-
150
-
151
-
152
-
153
-
154
-
155
-
156
-
157
-
158
-
159
-
160
-
161
-
162
-
163
-
164
-
165
-
166
-
167
-
168
-
169
-
170
-
171
-
172
-
173
-
174
-
175
-
176
-
177
-
178
-
179
-
180
-
181
-
182
-
183
-
184
-
185
-
186
 |
 |

several taxing authorities during 2009. The tax benefit was reduced by a goodwill impairment, a significant portion of which
was non-tax deductible. The 2008 effective tax rate included a discrete tax benefit related to the release of the deferred tax
liability of approximately $65.8 million (net of valuation allowance) in connection with the contribution of 3.6 million shares
of Coke common stock to the SunTrust Foundation.
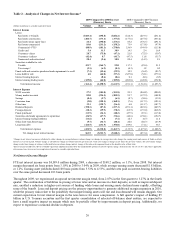
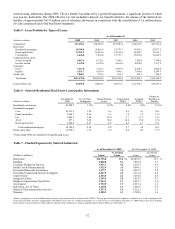
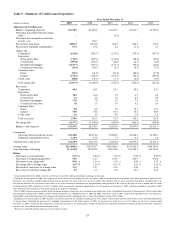
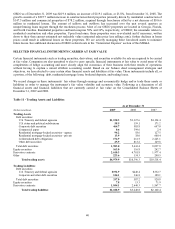
Table 5 - Loan Portfolio by Types of Loans
As of December 31
(Dollars in millions) 2009 2008 2007 2006 2005
Commercial $32,494.1 $41,039.9 $35,929.4 $34,613.9 $33,764.2
Real estate:
Residential mortgages 30,789.8 32,065.8 32,779.7 33,830.1 29,877.3
Home equity lines 15,952.5 16,454.4 14,911.6 14,102.7 13,635.7
Construction 6,646.8 9,864.0 13,776.7 13,893.0 11,046.9
Commercial real estate:
Owner occupied 8,915.4 8,758.1 7,948.5 7,709.0 7,398.6
Investor owned 6,159.0 6,199.0 4,661.0 4,858.8 5,117.4
Consumer:
Direct 5,117.8 5,139.3 3,963.9 4,160.1 5,060.8
Indirect 6,531.1 6,507.6 7,494.1 7,936.0 8,389.5
Credit card 1,068.3 970.3 854.1 350.7 264.5
Total loans $113,674.8 $126,998.4 $122,319.0 $121,454.3 $114,554.9
Loans held for sale $4,669.8 $4,032.1 $8,851.7 $11,790.1 $13,695.6
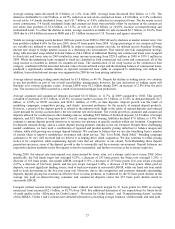
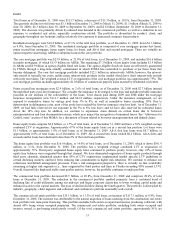
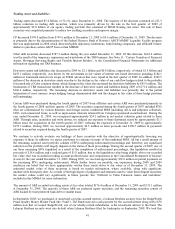
Table 6 - Selected Residential Real Estate Loan Quality Information
(Dollars in millions)
December 31,
2009
30 - 89 Days
Delinquent
Nonperforming
Loans
Nonaccruing
TDRs1
Accruing
TDRs
Portion of
Portfolio in
Florida
Residential construction $3,822.9 1.55% 34.8% 0.2% 0.0% 27.0 %
Residential mortgages:
Core 23,913.5 1.98 8.5 2.6 4.5 30.3
Prime second lien 2,904.1 2.46 3.1 1.2 3.3 11.9
Lot 1,086.9 3.00 25.0 3.7 11.7 53.1
Alt-A 897.1 5.22 30.2 14.2 15.0 19.0
Home equity loans 1,988.2 2.47 2.8 0.6 1.7 31.1
Total residential mortgages 30,789.8 2.18 8.8 2.7 4.8 29.1
Home equity lines 15,952.5 1.36 1.8 0.2 0.9 37.5
1Nonaccruing TDRs are included in Nonperforming Loans
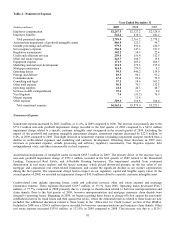
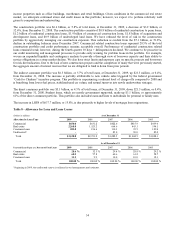
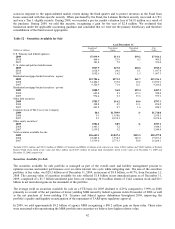
Table 7 - Funded Exposures by Selected Industries1
As of December 31, 2009 As of December 31, 2008
(Dollars in millions) Loans
% of Total
Loans Loans
% of Total
Loans
Real Estate $12,756.0 11.2 % $16,853.5 13.3 %
Retailing 6,060.8 5.3 7,207.8 5.7
Consumer Products & Services 5,933.7 5.2 6,187.5 4.9
Health Care & Pharmaceuticals 3,922.9 3.5 4,098.3 3.2
Diversified Financials & Insurance 3,477.7 3.1 4,033.5 3.2
Diversified Commercial Services & Supplies 2,867.9 2.5 3,313.2 2.6
Capital Goods 2,463.8 2.2 3,264.2 2.6
Energy & Utilities 2,195.1 1.9 3,414.7 2.7
Religious Organizations/Non-Profits 1,964.3 1.7 2,067.7 1.6
Government 1,954.9 1.7 2,015.4 1.6
Individuals, Inv. & Trusts 1,664.8 1.5 1,086.2 0.9
Media & Telecommunication Services 1,537.4 1.4 2,121.1 1.7
Materials 1,285.5 1.1 1,722.6 1.4
1Industry groupings have been modified from the prior year presentation that was based on the NAICS. The new presentation presents exposure to industries as a result of repayment risk
of the loan and allows for better comparability with industry peers who use a similar presentation. As a result of the new presentation, December 31, 2008 balances have been modified
from the prior year presentation to reflect industry repayment risk. Groupings are loans in aggregate greater than $1 billion as of December 31.
32