SunTrust 2009 Annual Report Download - page 173
Download and view the complete annual report
Please find page 173 of the 2009 SunTrust annual report below. You can navigate through the pages in the report by either clicking on the pages listed below, or by using the keyword search tool below to find specific information within the annual report.-
 1
1 -
2
-
3
-
4
-
5
-
6
-
7
-
8
-
9
-
10
-
11
-
12
-
13
-
14
-
15
-
16
-
17
-
18
-
19
-
20
-
21
-
22
-
23
-
24
-
25
-
26
-
27
-
28
-
29
-
30
-
31
-
32
-
33
-
34
-
35
-
36
-
37
-
38
-
39
-
40
-
41
-
42
-
43
-
44
-
45
-
46
-
47
-
48
-
49
-
50
-
51
-
52
-
53
-
54
-
55
-
56
-
57
-
58
-
59
-
60
-
61
-
62
-
63
-
64
-
65
-
66
-
67
-
68
-
69
-
70
-
71
-
72
-
73
-
74
-
75
-
76
-
77
-
78
-
79
-
80
-
81
-
82
-
83
-
84
-
85
-
86
-
87
-
88
-
89
-
90
-
91
-
92
-
93
-
94
-
95
-
96
-
97
-
98
-
99
-
100
-
101
-
102
-
103
-
104
-
105
-
106
-
107
-
108
-
109
-
110
-
111
-
112
-
113
-
114
-
115
-
116
-
117
-
118
-
119
-
120
-
121
-
122
-
123
-
124
-
125
-
126
-
127
-
128
-
129
-
130
-
131
-
132
-
133
-
134
-
135
-
136
-
137
-
138
-
139
-
140
-
141
-
142
-
143
-
144
-
145
-
146
-
147
-
148
-
149
-
150
-
151
-
152
-
153
-
154
-
155
-
156
-
157
-
158
-
159
-
160
-
161
-
162
-
 163
163 -
 164
164 -
 165
165 -
 166
166 -
 167
167 -
 168
168 -
 169
169 -
 170
170 -
 171
171 -
 172
172 -
 173
173 -
 174
174 -
 175
175 -
 176
176 -
 177
177 -
 178
178 -
 179
179 -
 180
180 -
 181
181 -
 182
182 -
 183
183 -
184
-
185
-
186
 |
 |

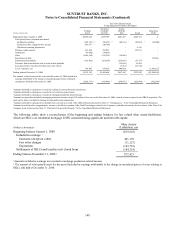
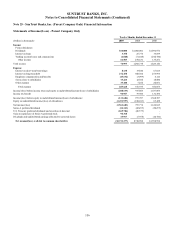
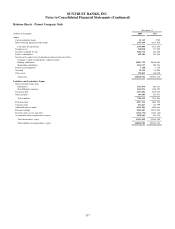
SUNTRUST BANKS, INC.
Notes to Consolidated Financial Statements (Continued)
Balance Sheets - Parent Company Only
December 31
(Dollars in thousands) 2009 2008
Assets
Cash in subsidiary banks $1,235 $769
Interest-bearing deposits in other banks 2,793,649 6,311,919
Cash and cash equivalents 2,794,884 6,312,688
Trading assets 340,938 337,499
Securities available for sale 5,643,734 246,850
Loans to subsidiaries 699,202 984,303
Investment in capital stock of subsidiaries stated on the basis of the
Company’s equity in subsidiaries’ capital accounts:
Banking subsidiaries 19,021,759 20,469,508
Nonbanking subsidiaries 1,136,737 929,726
Premises and equipment 1,160 1,356
Goodwill 99,355 98,905
Other assets 393,013 460,310
Total assets $30,130,782 $29,841,145
Liabilities and Shareholders’ Equity
Short-term borrowings from:
Subsidiaries $271,936 $86,161
Non-affiliated companies 1,362,922 1,104,555
Long-term debt 5,473,682 5,676,349
Other liabilities 599,583 585,971
Total liabilities 7,708,123 7,453,036
Preferred stock 4,917,312 5,221,703
Common stock 514,667 372,799
Additional paid in capital 8,521,042 6,904,644
Retained earnings 8,562,807 10,388,984
Treasury stock, at cost, and other (1,163,332) (1,481,146)
Accumulated other comprehensive income 1,070,163 981,125
Total shareholders’ equity 22,422,659 22,388,109
Total liabilities and shareholders’ equity $30,130,782 $29,841,145
157