SunTrust 2009 Annual Report Download - page 67
Download and view the complete annual report
Please find page 67 of the 2009 SunTrust annual report below. You can navigate through the pages in the report by either clicking on the pages listed below, or by using the keyword search tool below to find specific information within the annual report.-
 1
1 -
2
-
3
-
4
-
5
-
6
-
7
-
8
-
9
-
10
-
11
-
12
-
13
-
14
-
15
-
16
-
17
-
18
-
19
-
20
-
21
-
22
-
23
-
24
-
25
-
26
-
27
-
28
-
29
-
30
-
31
-
32
-
33
-
34
-
35
-
36
-
37
-
38
-
39
-
40
-
41
-
42
-
43
-
44
-
45
-
46
-
47
-
48
-
49
-
50
-
51
-
52
-
53
-
54
-
55
-
56
-
 57
57 -
 58
58 -
 59
59 -
 60
60 -
 61
61 -
 62
62 -
 63
63 -
 64
64 -
 65
65 -
 66
66 -
 67
67 -
 68
68 -
 69
69 -
 70
70 -
 71
71 -
 72
72 -
 73
73 -
 74
74 -
 75
75 -
 76
76 -
 77
77 -
78
-
79
-
80
-
81
-
82
-
83
-
84
-
85
-
86
-
87
-
88
-
89
-
90
-
91
-
92
-
93
-
94
-
95
-
96
-
97
-
98
-
99
-
100
-
101
-
102
-
103
-
104
-
105
-
106
-
107
-
108
-
109
-
110
-
111
-
112
-
113
-
114
-
115
-
116
-
117
-
118
-
119
-
120
-
121
-
122
-
123
-
124
-
125
-
126
-
127
-
128
-
129
-
130
-
131
-
132
-
133
-
134
-
135
-
136
-
137
-
138
-
139
-
140
-
141
-
142
-
143
-
144
-
145
-
146
-
147
-
148
-
149
-
150
-
151
-
152
-
153
-
154
-
155
-
156
-
157
-
158
-
159
-
160
-
161
-
162
-
163
-
164
-
165
-
166
-
167
-
168
-
169
-
170
-
171
-
172
-
173
-
174
-
175
-
176
-
177
-
178
-
179
-
180
-
181
-
182
-
183
-
184
-
185
-
186
 |
 |

CAPITAL RESOURCES
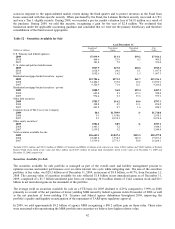
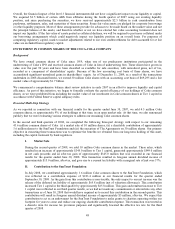
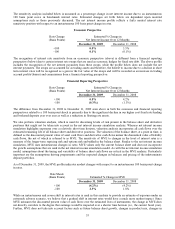
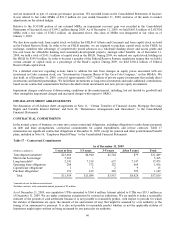
Table 15 – Capital Ratios
As of December 31
(Dollars in millions) 2009 2008 2007
Tier 1 capital1$18,068.8 $17,613.7 $11,424.9
Total capital 22,895.2 22,743.4 16,994.1
Risk-weighted assets 139,379.5 162,046.4 164,931.9
Tier 1 capital1$18,068.8 $17,613.7 $11,424.9
Less:
Qualifying trust preferred securities 2,356.4 2,847.3 2,133.4
Preferred stock 4,917.3 5,221.7 500.0
Allowable minority interest 103.6 101.8 105.0
Tier 1 common equity $10,691.5 $9,442.9 $8,686.5
Risk-based ratios:
Tier 1 common equity 7.67 % 5.83 % 5.27 %
Tier 1 capital 12.96 10.87 6.93
Total capital 16.43 14.04 10.30
Tier 1 leverage ratio 10.90 10.45 6.90
Total shareholders’ equity to assets 12.94 11.90 10.12
1Tier 1 capital includes trust preferred obligations of $2.4 billion at the end of 2009, $2.8 billion at the end of 2008, and $2.1 billion at the end of 2007. Tier 1 capital
also includes qualifying minority interests in consolidated subsidiaries of $103.6 million at the end of 2009, $101.8 million at the end of 2008, and $105.0 million at
the end of 2007.
Our primary regulator, the Federal Reserve, measures capital adequacy within a framework that makes capital requirements
sensitive to the risk profiles of individual banking companies. The guidelines weigh assets and off-balance sheet risk
exposures (risk weighted assets) according to predefined classifications, creating a base from which to compare capital
levels. Tier 1 capital primarily includes realized equity and qualified preferred instruments, less purchase accounting
intangibles such as goodwill and core deposit intangibles. Total capital consists of Tier 1 capital and Tier 2 capital, which
includes qualifying portions of subordinated debt, allowance for loan losses up to a maximum of 1.25% of risk weighted
assets, and 45% of the unrealized gain on equity securities.
Both the Company and the Bank are subject to a minimum Tier 1 capital and total capital ratios of 4% and 8%, respectively,
of risk weighted assets. To be considered “well-capitalized,” ratios of 6% and 10%, respectively, are required. Additionally,
the Company and the Bank are subject to Tier 1 leverage ratio requirements, which measures Tier 1 capital against average
assets. The minimum and well-capitalized ratios are 3% and 5%, respectively.
The Tier 1 common equity, Tier 1 capital, and total capital ratios improved from 5.83%, 10.87%, and 14.04%, respectively,
at December 31, 2008 to 7.67%, 12.96%, and 16.43%, respectively, at December 31, 2009. The primary drivers of the
increase were the successful completion of our capital plan during the second quarter of 2009 and a $22.7 billion, or 14.0%,
reduction in risk-weighted assets. The reduction in risk-weighted assets was due primarily to the $13.3 billion decline in
loans held for investment. Also contributing to the reduction was a reduction in unfunded loan commitments and letters of
credit during the year.
The Board of Governors of the Federal Reserve System, the Federal Reserve Banks, the FDIC and the Office of the
Comptroller of the Currency completed, in May 2009, the SCAP review of the potential capital needs through the end of
2010 of the nineteen largest U.S. bank holding companies. The Federal Reserve advised us that based on the SCAP review,
we presently have and are projected to continue to have Tier 1 capital well in excess of the amount required to be well
capitalized through the forecast period under both the baseline scenario and the more adverse-than-expected scenario (“more
adverse”) as prepared by the U.S. Treasury. The SCAP’s more adverse scenario represented a hypothetical scenario that
involves a recession that is longer and more severe than consensus expectations and results in higher than expected credit
losses, but is not a forecast of expected losses or revenues. The Federal Reserve advised us in May 2009, based on the more
adverse scenario, that we needed to adjust the composition of our Tier 1 capital by increasing the Tier 1 common equity
portion by $2.2 billion. The additional common equity was necessary to maintain Tier 1 common equity at 4% of risk
weighted assets under the more adverse scenario, as specified by a new regulatory standard that was introduced as part of the
stress test. They also intend the additional common equity to serve as a buffer against higher losses than generally expected
and to allow such bank holding companies to remain well capitalized and able to lend to creditworthy borrowers should such
losses materialize. Our 2009 actual credit losses were significantly less than the projections utilized in the SCAP process.
As a result of the Federal Reserve establishing this capital target, we successfully completed a capital plan during the second
quarter of 2009 that adjusted the composition of our Tier 1 capital by increasing the portion that is composed of Tier 1
common equity. The capital plan consisted of various transactions that generated an additional $2.3 billion in Tier 1 common
51