SunTrust 2009 Annual Report Download - page 114
Download and view the complete annual report
Please find page 114 of the 2009 SunTrust annual report below. You can navigate through the pages in the report by either clicking on the pages listed below, or by using the keyword search tool below to find specific information within the annual report.-
 1
1 -
2
-
3
-
4
-
5
-
6
-
7
-
8
-
9
-
10
-
11
-
12
-
13
-
14
-
15
-
16
-
17
-
18
-
19
-
20
-
21
-
22
-
23
-
24
-
25
-
26
-
27
-
28
-
29
-
30
-
31
-
32
-
33
-
34
-
35
-
36
-
37
-
38
-
39
-
40
-
41
-
42
-
43
-
44
-
45
-
46
-
47
-
48
-
49
-
50
-
51
-
52
-
53
-
54
-
55
-
56
-
57
-
58
-
59
-
60
-
61
-
62
-
63
-
64
-
65
-
66
-
67
-
68
-
69
-
70
-
71
-
72
-
73
-
74
-
75
-
76
-
77
-
78
-
79
-
80
-
81
-
82
-
83
-
84
-
85
-
86
-
87
-
88
-
89
-
90
-
91
-
92
-
93
-
94
-
95
-
96
-
97
-
98
-
99
-
100
-
101
-
102
-
103
-
 104
104 -
 105
105 -
 106
106 -
 107
107 -
 108
108 -
 109
109 -
 110
110 -
 111
111 -
 112
112 -
 113
113 -
 114
114 -
 115
115 -
 116
116 -
 117
117 -
 118
118 -
 119
119 -
 120
120 -
 121
121 -
 122
122 -
 123
123 -
 124
124 -
125
-
126
-
127
-
128
-
129
-
130
-
131
-
132
-
133
-
134
-
135
-
136
-
137
-
138
-
139
-
140
-
141
-
142
-
143
-
144
-
145
-
146
-
147
-
148
-
149
-
150
-
151
-
152
-
153
-
154
-
155
-
156
-
157
-
158
-
159
-
160
-
161
-
162
-
163
-
164
-
165
-
166
-
167
-
168
-
169
-
170
-
171
-
172
-
173
-
174
-
175
-
176
-
177
-
178
-
179
-
180
-
181
-
182
-
183
-
184
-
185
-
186
 |
 |

SUNTRUST BANKS, INC.
Notes to Consolidated Financial Statements (Continued)
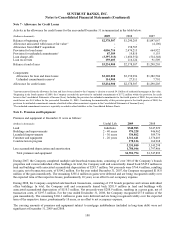
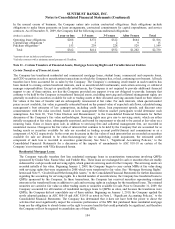
collateral and the transaction structure. The cash flow models incorporate the remaining cash flows which are adjusted for
future expected credit losses. Future expected credit losses are determined by using various assumptions, the most significant
of which include current default rates, prepayment rates, and loss severities. For the majority of the securities that we have
reviewed for OTTI, credit information is available and modeled at the loan level detail underlying each security and also
considers information such as loan to collateral values, FICO scores, and geographic considerations such as home price
appreciation/depreciation. These inputs are updated on a regular basis to ensure the most current credit and other assumptions
are utilized in the analysis. If, based on this analysis, the Company does not expect to recover the entire amortized cost basis
of the security, the expected cash flows are then discounted at the security’s initial effective interest rate to arrive at a present
value amount. OTTI credit losses reflect the difference between the present value of cash flows expected to be collected and
the amortized cost basis of these securities. During the year ended December 31, 2009, all but an insignificant amount of
credit-related OTTI recognized in earnings on private residential MBS have underlying collateral of loans originated in 2006
and 2007, the majority of which were originated by the Company and therefore have geographic concentrations in the
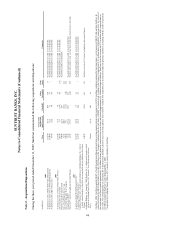
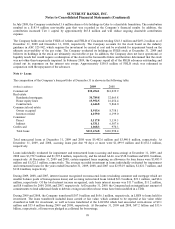
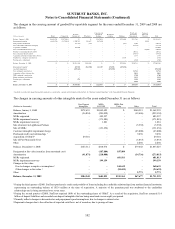
Company’s primary footprint. The following table presents a summary of the significant inputs used in determining the
measurement of credit losses recognized in earnings for private residential MBS for the year ended December 31, 2009:
Year Ended
December 31, 2009
Current default rate 2 - 17%
Prepayment rate 6 - 21%
Loss severity 35 - 52%
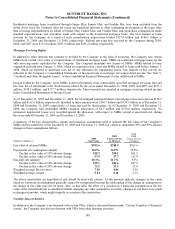
For the year ended December 31, 2009, the Company recorded OTTI losses on available for sale securities as follows:
Year Ended December 31
2009
(Dollars in thousands)
Residential
Mortgage-Backed
Securities - Private
Corporate
Bonds
Other
Securities
Total other than temporary impairment losses $111,969 $639 $212
Portion of losses recognized in other comprehensive income (before taxes) 92,820 - -
Net impairment losses recognized in earnings $19,149 $639 $212
The following is a rollforward of credit losses recognized in earnings for the nine months ended December 31, 2009 related
to securities for which some portion of the impairment was recorded in OCI.
(Dollars in thousands)
Nine Months
Ended December 31,
20091
Balance, as of April 1, 2009, effective date $7,646
Additions:
OTTI credit losses on securities not previously impaired 17,672
Reductions:
Credit impaired securities sold, matured, or written off (3,716)
Balance, as of December 31, 2009 $21,602
1During the nine month period from the effective date to December 31, 2009, the Company
recognized $2.3 million of OTTI through earnings on debt securities in which no portion of the
OTTI loss remained in AOCI at any time during the period. OTTI related to these securities are
excluded from these amounts.
During 2008, the Company recorded $83.8 million in OTTI, which included the non-credit component of impairment, within
securities gains/(losses), primarily related to $269.4 million in private residential MBS and residual interests in mortgage
securitizations in which the default rates and loss severities of the underlying collateral, including subprime and Alt-A loans,
increased significantly during the year. Impairment was recorded on securities for which there had been an adverse change in
estimated cash flows for purposes of determining fair value. These securities were valued using either third party pricing
data, including broker indicative bids, or expected cash flow models. There were no similar charges recorded in 2007.
In June 2008, the Company sold 10 million shares of its holdings in Coke. The sale of these shares generated $548.8 million
in net cash proceeds and before-tax gains, and an after-tax gain of approximately $345 million that was recorded in the
Company’s financial results. In addition, these sales resulted in an increase of approximately $345 million to Tier 1 capital.
98