SunTrust 2009 Annual Report Download - page 101
Download and view the complete annual report
Please find page 101 of the 2009 SunTrust annual report below. You can navigate through the pages in the report by either clicking on the pages listed below, or by using the keyword search tool below to find specific information within the annual report.-
 1
1 -
2
-
3
-
4
-
5
-
6
-
7
-
8
-
9
-
10
-
11
-
12
-
13
-
14
-
15
-
16
-
17
-
18
-
19
-
20
-
21
-
22
-
23
-
24
-
25
-
26
-
27
-
28
-
29
-
30
-
31
-
32
-
33
-
34
-
35
-
36
-
37
-
38
-
39
-
40
-
41
-
42
-
43
-
44
-
45
-
46
-
47
-
48
-
49
-
50
-
51
-
52
-
53
-
54
-
55
-
56
-
57
-
58
-
59
-
60
-
61
-
62
-
63
-
64
-
65
-
66
-
67
-
68
-
69
-
70
-
71
-
72
-
73
-
74
-
75
-
76
-
77
-
78
-
79
-
80
-
81
-
82
-
83
-
84
-
85
-
86
-
87
-
88
-
89
-
90
-
 91
91 -
 92
92 -
 93
93 -
 94
94 -
 95
95 -
 96
96 -
 97
97 -
 98
98 -
 99
99 -
 100
100 -
 101
101 -
 102
102 -
 103
103 -
 104
104 -
 105
105 -
 106
106 -
 107
107 -
 108
108 -
 109
109 -
 110
110 -
 111
111 -
112
-
113
-
114
-
115
-
116
-
117
-
118
-
119
-
120
-
121
-
122
-
123
-
124
-
125
-
126
-
127
-
128
-
129
-
130
-
131
-
132
-
133
-
134
-
135
-
136
-
137
-
138
-
139
-
140
-
141
-
142
-
143
-
144
-
145
-
146
-
147
-
148
-
149
-
150
-
151
-
152
-
153
-
154
-
155
-
156
-
157
-
158
-
159
-
160
-
161
-
162
-
163
-
164
-
165
-
166
-
167
-
168
-
169
-
170
-
171
-
172
-
173
-
174
-
175
-
176
-
177
-
178
-
179
-
180
-
181
-
182
-
183
-
184
-
185
-
186
 |
 |

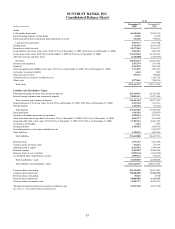
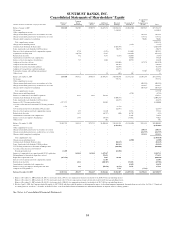
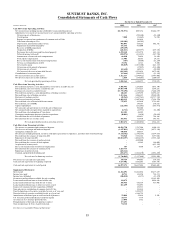
SUNTRUST BANKS, INC.
Consolidated Statements of Cash Flows
For the Year Ended December 31
(Dollars in thousands) 2009 2008 2007
Cash Flows from Operating Activities:
Net income/(loss) including income attributable to noncontrolling interest ($1,551,571) $807,152 $1,646,739
Adjustments to reconcile net income/(loss) to net cash provided by operating activities:
Net gain on sale of businesses -(198,140) (32,340)
Visa litigation 7,000 (33,469) 76,930
Expense recognized on contribution of common stock of Coke -183,418 -
Gain from ownership in Visa (112,102) (86,305) -
Depreciation, amortization and accretion 966,093 824,263 802,342
Impairment of goodwill/intangibles 751,156 415,000 -
Recovery of MSRs impairment (199,159) --
Origination of MSRs (681,813) (485,597) (639,158)
Provisions for credit losses and foreclosed property 4,270,340 2,551,574 683,114
Deferred income tax benefit (894,974) (221,235) (147,758)
Amortization of restricted stock compensation 66,420 76,656 34,820
Stock option compensation 11,406 20,185 24,275
Excess tax benefits from stock-based compensation (387) (4,580) (11,259)
Net loss on extinguishment of debt 39,356 11,723 9,800
Net securities gains (98,019) (1,073,300) (243,117)
Net gain on sale/leaseback of premises -(37,039) (118,840)
Net gain on sale of assets (65,648) (60,311) (30,569)
Net (increase)/decrease in loans held for sale (965,249) 4,191,838 2,479,428
Contributions to retirement plans (25,666) (386,535) (11,185)
Net (increase)/decrease in other assets 1,522,117 (2,694,422) (1,993,001)
Net (decrease)/increase in other liabilities 2,864 (184,601) 1,200,614
Net cash provided by operating activities 3,042,164 3,616,275 3,730,835
Cash Flows from Investing Activities:
Proceeds from maturities, calls and paydowns of securities available for sale 3,406,941 1,292,065 1,073,340
Proceeds from sales of securities available for sale 19,487,740 5,737,627 1,199,231
Purchases of securities available for sale (33,793,498) (8,170,824) (7,640,289)
Proceeds from maturities, calls and paydowns of trading securities 148,283 4,329,198 11,896,617
Proceeds from sales of trading securities 2,113,466 3,046,185 19,240,250
Purchases of trading securities (85,965) (3,687,561) (22,717,152)
Net decrease/(increase) in loans 8,609,239 (5,807,828) (7,158,570)
Proceeds from sales of loans held for investment 755,855 881,410 5,721,662
Proceeds from sale of MSRs -148,387 270,215
Capital expenditures (212,186) (221,602) (186,431)
Net cash and cash equivalents received for sale of businesses -301,604 -
Net cash paid and cash equivalents acquired in acquisitions (6,711) (23,931) (32,200)
Proceeds from sale/redemption of Visa shares 112,102 86,305 -
Contingent consideration payouts related to acquisitions (18,043) (2,830) (50,689)
Proceeds from the sale/leaseback of premises -288,851 764,368
Proceeds from the sale of other assets 566,451 318,910 145,871
Net cash provided by/(used) in investing activities 1,083,674 (1,484,034) 2,526,223
Cash Flows from Financing Activities:
Net increase in consumer and commercial deposits 10,582,750 1,767,908 2,100,134
Net decrease in foreign and brokered deposits (2,497,023) (7,917,898) (8,273,116)
Assumption of deposits, net 448,858 160,517 -
Net decrease in funds purchased, securities sold under agreements to repurchase, and other short-term borrowings (4,114,382) (2,796,359) (1,679,833)
Proceeds from the issuance of long-term debt 574,560 7,834,388 5,197,020
Repayment of long-term debt (10,034,157) (4,024,675) (1,553,412)
Proceeds from the issuance of preferred stock -4,850,000 -
Proceeds from the exercise of stock options -25,569 186,000
Acquisition of treasury stock -- (853,385)
Excess tax benefits from stock-based compensation 387 4,580 11,259
Proceeds from the issuance of common stock 1,829,735 --
Repurchase of preferred stock (228,124) --
Common and preferred dividends paid (328,673) (1,041,470) (1,056,869)
Net cash used in financing activities (3,766,069) (1,137,440) (5,922,202)
Net increase in cash and cash equivalents 359,769 994,801 334,856
Cash and cash equivalents at beginning of period 6,637,402 5,642,601 5,307,745
Cash and cash equivalents at end of period $6,997,171 $6,637,402 $5,642,601
Supplemental Disclosures:
Interest paid $2,366,891 $3,868,034 $5,277,639
Income taxes paid 44,723 341,396 724,351
Income taxes refunded (106,020) (4,275) (13,859)
Securities transferred from available for sale to trading -- 15,143,109
Loans transferred from loans to loans held for sale 124,879 - 4,054,246
Loans transferred from loans held for sale to loans 306,966 656,134 837,401
Loans transferred from loans to other real estate owned 811,659 754,091 -
Issuance of common stock for acquisition of GB&T -154,513 -
Noncash gain on contribution of common stock of Coke -183,418 -
Unsettled purchases of securities available for sale as of year-end -8,898,279 -
Unsettled sales of securities available for sale as of year-end -6,386,795 -
Amortization of deferred gain on sale/leaseback of premises 59,044 55,616 5,301
U.S. Treasury preferred dividend accrued but unpaid 10,777 7,778 -
Accretion on U.S. Treasury preferred stock 23,098 3,732 -
Extinguishment of forward stock purchase contract 173,653 --
Gain on repurchase of Series A preferred stock 94,318 --
See Notes to Consolidated Financial Statements.
85