SunTrust 2009 Annual Report Download - page 66
Download and view the complete annual report
Please find page 66 of the 2009 SunTrust annual report below. You can navigate through the pages in the report by either clicking on the pages listed below, or by using the keyword search tool below to find specific information within the annual report.-
 1
1 -
2
-
3
-
4
-
5
-
6
-
7
-
8
-
9
-
10
-
11
-
12
-
13
-
14
-
15
-
16
-
17
-
18
-
19
-
20
-
21
-
22
-
23
-
24
-
25
-
26
-
27
-
28
-
29
-
30
-
31
-
32
-
33
-
34
-
35
-
36
-
37
-
38
-
39
-
40
-
41
-
42
-
43
-
44
-
45
-
46
-
47
-
48
-
49
-
50
-
51
-
52
-
53
-
54
-
55
-
 56
56 -
 57
57 -
 58
58 -
 59
59 -
 60
60 -
 61
61 -
 62
62 -
 63
63 -
 64
64 -
 65
65 -
 66
66 -
 67
67 -
 68
68 -
 69
69 -
 70
70 -
 71
71 -
 72
72 -
 73
73 -
 74
74 -
 75
75 -
 76
76 -
77
-
78
-
79
-
80
-
81
-
82
-
83
-
84
-
85
-
86
-
87
-
88
-
89
-
90
-
91
-
92
-
93
-
94
-
95
-
96
-
97
-
98
-
99
-
100
-
101
-
102
-
103
-
104
-
105
-
106
-
107
-
108
-
109
-
110
-
111
-
112
-
113
-
114
-
115
-
116
-
117
-
118
-
119
-
120
-
121
-
122
-
123
-
124
-
125
-
126
-
127
-
128
-
129
-
130
-
131
-
132
-
133
-
134
-
135
-
136
-
137
-
138
-
139
-
140
-
141
-
142
-
143
-
144
-
145
-
146
-
147
-
148
-
149
-
150
-
151
-
152
-
153
-
154
-
155
-
156
-
157
-
158
-
159
-
160
-
161
-
162
-
163
-
164
-
165
-
166
-
167
-
168
-
169
-
170
-
171
-
172
-
173
-
174
-
175
-
176
-
177
-
178
-
179
-
180
-
181
-
182
-
183
-
184
-
185
-
186
 |
 |

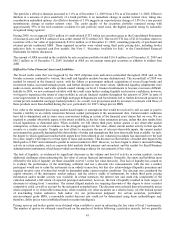
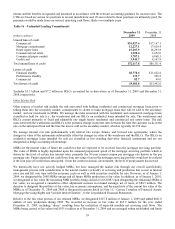
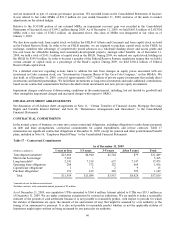
DEPOSITS
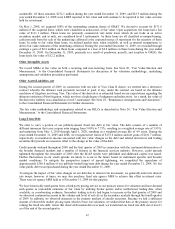
Table 14 – Composition of Average Deposits
Year Ended December 31 Percent of Total
(Dollars in millions) 2009 2008 2007 2009 2008 2007
Noninterest-bearing $24,249.2 $20,949.0 $21,677.2 20.3 % 18.0 % 18.1 %
NOW accounts 23,600.6 21,080.7 20,042.8 19.8 18.2 16.7
Money market accounts 31,863.5 26,564.8 22,676.7 26.7 22.9 18.9
Savings 3,664.2 3,770.9 4,608.7 3.1 3.2 3.8
Consumer time 16,718.1 16,770.2 16,941.3 14.0 14.5 14.2
Other time 13,068.4 12,197.2 12,073.5 11.0 10.5 10.1
Total consumer and commercial
deposits 113,164.0 101,332.8 98,020.2 94.9 87.3 81.8
Brokered deposits 5,648.3 10,493.2 16,091.9 4.7 9.0 13.4
Foreign deposits 433.9 4,250.3 5,764.5 0.4 3.7 4.8
Total deposits $119,246.2 $116,076.3 $119,876.6 100.0 % 100.0 % 100.0 %
Average consumer and commercial deposits increased during 2009 by $11.8 billion, or 11.7%, compared to 2008 with the
growth concentrated in noninterest bearing DDA, NOW, and money market accounts. The increase was partially offset by
declines in savings and consumer time account balances. During 2009, deposits increased and our deposit mix improved as a
result of our marketing efforts, pricing discipline with respect to interest-bearing deposits, improving operational execution,
as well as an industry-wide flight to the safety of insured deposits.
Consumer and commercial deposit growth is one of our key initiatives, as we focus on deposit gathering opportunities across
all lines of business throughout the geographic footprint. All 16 regions within which we operate exhibited deposit growth
during 2009. Deposit growth was accomplished through a judicious use of competitive rates in select products and select
geographies. Other initiatives to attract deposits included innovative product and features offerings, enhanced programs and
initiatives like regional pricing, new and retention-oriented money offers, more customer-targeted offers, and advanced
analytics that leverage product offerings with customer segmentation. We continued to leverage the “Live Solid. Bank
Solid.” branding and marketing campaign to improve our visibility in the marketplace. It is designed to speak to what is
important to clients in the current environment and to inspire customer loyalty and capitalize on some of the opportunities
presented by the new banking landscape. Notwithstanding these deposit generation successes, some of the deposit growth is
due to seasonality and the economic environment. Deposit balances are expected to decline modestly in the first quarter
related to seasonality, and further over time as the economy improves. Average brokered and foreign deposits decreased by
$8.7 billion, or 58.8%, during 2009 compared to 2008. The decrease was due to our ability to grow deposits and, in turn,
reduce our reliance upon wholesale funding sources. As of December 31, 2009, securities pledges as collateral for deposits
totaled $9.0 billion.
In November 2008, the FDIC created the TLGP to strengthen confidence and encourage liquidity in the banking system by
guaranteeing newly issued senior unsecured debt of banks, thrifts, and certain holding companies via its DGP, and by
providing full coverage of non-interest bearing deposit transaction accounts and capped NOW accounts, regardless of dollar
amount via its TAGP. As of October 31, 2009, banks are no longer eligible to issue additional debt under the TLGP. We have
opted not to participate in the TAGP beyond December 31, 2009.
OTHER SHORT-TERM BORROWINGS AND LONG-TERM DEBT
Other short-term borrowings decreased $3.1 billion, or 60.1%, from December 31, 2008 to $2.1 billion at December 31,
2009. During November and December of 2008, we purchased $2.5 billion in three-month funding under the TAF in support
of the Federal Reserve’s initiative. During the first quarter of 2009, our core deposit growth allowed us to discontinue the use
of this source of short-term funding which was the primary cause for the overall decrease during the year.
Long-term debt decreased $9.3 billion, or 34.8%, from December 31, 2008 to $17.5 billion at December 31, 2009. The
change in long-term debt was primarily the result of the repayment of $7.4 billion of FHLB advances, $3.4 billion of which
were at fair value. Repayment was assisted by the growth during the year of our core deposit portfolio. Additionally, we
repurchased approximately $500 million of Parent Company junior subordinated notes and approximately $300 million of
Parent Company debt matured during 2009. In the first quarter of 2009, we issued $576.0 million of unsecured senior
floating rate notes maturing in 2012 under the terms of the TLGP.
50