SunTrust 2009 Annual Report Download - page 49
Download and view the complete annual report
Please find page 49 of the 2009 SunTrust annual report below. You can navigate through the pages in the report by either clicking on the pages listed below, or by using the keyword search tool below to find specific information within the annual report.-
 1
1 -
2
-
3
-
4
-
5
-
6
-
7
-
8
-
9
-
10
-
11
-
12
-
13
-
14
-
15
-
16
-
17
-
18
-
19
-
20
-
21
-
22
-
23
-
24
-
25
-
26
-
27
-
28
-
29
-
30
-
31
-
32
-
33
-
34
-
35
-
36
-
37
-
38
-
 39
39 -
 40
40 -
 41
41 -
 42
42 -
 43
43 -
 44
44 -
 45
45 -
 46
46 -
 47
47 -
 48
48 -
 49
49 -
 50
50 -
 51
51 -
 52
52 -
 53
53 -
 54
54 -
 55
55 -
 56
56 -
 57
57 -
 58
58 -
 59
59 -
60
-
61
-
62
-
63
-
64
-
65
-
66
-
67
-
68
-
69
-
70
-
71
-
72
-
73
-
74
-
75
-
76
-
77
-
78
-
79
-
80
-
81
-
82
-
83
-
84
-
85
-
86
-
87
-
88
-
89
-
90
-
91
-
92
-
93
-
94
-
95
-
96
-
97
-
98
-
99
-
100
-
101
-
102
-
103
-
104
-
105
-
106
-
107
-
108
-
109
-
110
-
111
-
112
-
113
-
114
-
115
-
116
-
117
-
118
-
119
-
120
-
121
-
122
-
123
-
124
-
125
-
126
-
127
-
128
-
129
-
130
-
131
-
132
-
133
-
134
-
135
-
136
-
137
-
138
-
139
-
140
-
141
-
142
-
143
-
144
-
145
-
146
-
147
-
148
-
149
-
150
-
151
-
152
-
153
-
154
-
155
-
156
-
157
-
158
-
159
-
160
-
161
-
162
-
163
-
164
-
165
-
166
-
167
-
168
-
169
-
170
-
171
-
172
-
173
-
174
-
175
-
176
-
177
-
178
-
179
-
180
-
181
-
182
-
183
-
184
-
185
-
186
 |
 |
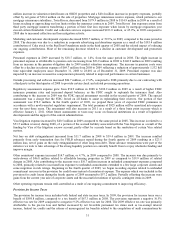
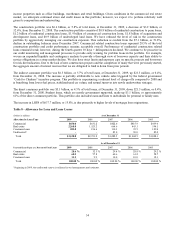
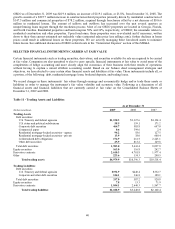
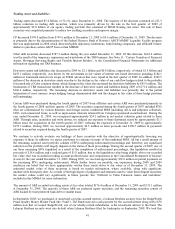
Loans
Total loans as of December 31, 2009 were $113.7 billion, a decrease of $13.3 billion, or 10.5%, from December 31, 2008.
The quarterly decline in total loans was $3.1 billion (December 31, 2008 to March 31, 2009); $1.1 billion (March 31, 2009 to
June 30, 2009); $6.3 billion (June 30, 2009 to September 30, 2009); and $2.8 billion (September 30, 2009 to December 31,
2009). The decrease was primarily driven by reduced loan demand in the commercial portfolio, as well as a reduction in our
exposure to residential real estate, especially construction related. The portfolio is diversified by product, client, and
geography throughout our footprint, and has relatively low exposure to unsecured consumer loan products.
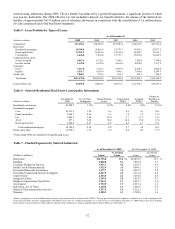
Residential mortgages were $30.8 billion, or 27.1% of the total loan portfolio, as of December 31, 2009, down $1.3 billion,
or 4.0%, from December 31, 2008. The residential mortgage portfolio is comprised of core mortgages (prime first liens),
prime second lien mortgages, home equity loans, lot loans, and Alt-A first and second mortgages. There are virtually no
option (negative amortizing) ARMs or subprime loans in the core portfolio.
The core mortgage portfolio was $23.9 billion, or 21.0% of total loans, as of December 31, 2009, and includes $16.6 billion
in jumbo mortgages, of which $13.9 billion are ARMs. The remaining $7.3 billion of non jumbo loans includes $3.5 billion
in ARMs and $0.9 billion in agency-eligible fixed rate loans. The agency-eligible fixed rate loans are effectively guaranteed
by FNMA through a long-term standby commitment in which FNMA has committed to purchase at par those loans that
become delinquent. The core first mortgage portfolio included $12.1 billion in interest-only ARMs; however, the interest-
only period is typically ten years, unlike many interest-only products in the market which have short interest-only periods
with early reset dates. The weighted average LTV at origination of the core mortgage portfolio was approximately 75%. The
core mortgage portfolio includes approximately $1.0 billion of commercial purpose loans secured by residential real estate.
Prime second lien mortgages were $2.9 billion, or 2.6% of total loans, as of December 31, 2009 with $2.7 billion insured
through third party pool-level insurance. We consider the insurance to be integral to the loan and include probable insurance
proceeds in our analysis of the collectability of the loans. Total claims paid during 2009 and 2008 under the mortgage
insurance arrangements were $111.7 million and $43.8 million, respectively. Under the insurance arrangement, we are
exposed to cumulative losses by vintage pool from 5% to 8%, as well as cumulative losses exceeding 10%. Due to
deterioration in delinquency rates, most of the pools have reached the first tier insurance stop loss limit. As of December 31,
2009, we had fully reserved for our exposure in the 5% to 8% loss layer, and we have also reserved for estimated losses
above the 10% stop loss. In addition, we continue to experience claim denials on certain loans due to borrower
misrepresentation and loan documentation issues, which may impact the recognition of uninsured losses. See “Allowance for
Credit Losses” section of this MD&A for a discussion of losses related to borrower misrepresentation and denied claims.
Home equity loans comprise $2.0 billion, or 1.7% of total loans, as of December 31, 2009 and have a 76% weighted average
combined LTV at origination. Approximately 67% of the home equity loans are in a second lien position. Lot loans were
$1.1 billion, or approximately 1.0% of total loans, as of December 31, 2009. Alt-A first lien loans were $0.7 billion, or
approximately 0.6% of total loans, as of December 31, 2009. Alt-A second lien loans totaled $0.2 billion. Alt-A firsts and
seconds and lot loans have declined to less than 2% of the total loan portfolio.
The home equity line portfolio was $16.0 billion, or 14.0% of total loans, as of December 31, 2009, which is down $501.9
million, or 3.1%, from December 31, 2008. The portfolio has a weighted average combined LTV at origination of
approximately 73%. Third party originated home equity lines continued to perform poorly, however, only 10% of home
equity line balances were originated through that channel. We have eliminated origination of home equity products through
third party channels, eliminated greater than 85% of LTV originations, implemented market specific LTV guidelines in
certain declining markets, and have been reducing line commitments in higher risk situations. We continue to enhance our
collections and default management processes. From a risk management perspective, there is virtually no line availability
remaining in higher risk segments (i.e., lines originated by third parties and lines in Florida exceeding 80% current LTV).
Overall, this portfolio displayed stable asset quality metrics; however, the portfolio continues to under perform.
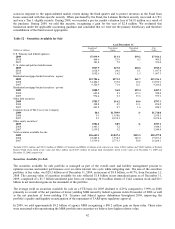
The commercial loan portfolio decreased $8.5 billion, or 20.8%, from December 31, 2008 and comprises 28.6% of total
loans at December 31, 2009. The reduction in the commercial portfolio resulted primarily from a continued trend of
declining line of credit utilization among our mid-size and larger corporate clients due to lower working capital needs and
enhanced access to the capital markets. The pace of decline did slow during the fourth quarter. The portfolio is diversified by
industry, geography, client segment, and collateral; and continues to perform reasonably well overall.
The commercial real estate portfolio was $15.1 billion, or 13.3% of total loans, an increase of $117.3 million, or 0.8%, from
December 31, 2008. The increase was attributable to the natural migration of loans maturing from the construction real estate
loan portfolio into mini-perm financing. This portfolio includes both owner-occupied and income producing collateral, with
almost 60% being owner occupied properties. The commercial real estate portfolio, including both owner occupied and
investor owned, is performing satisfactorily overall. Of the total commercial real estate portfolio, approximately 81% are
33