SunTrust 2009 Annual Report Download - page 54
Download and view the complete annual report
Please find page 54 of the 2009 SunTrust annual report below. You can navigate through the pages in the report by either clicking on the pages listed below, or by using the keyword search tool below to find specific information within the annual report.-
 1
1 -
2
-
3
-
4
-
5
-
6
-
7
-
8
-
9
-
10
-
11
-
12
-
13
-
14
-
15
-
16
-
17
-
18
-
19
-
20
-
21
-
22
-
23
-
24
-
25
-
26
-
27
-
28
-
29
-
30
-
31
-
32
-
33
-
34
-
35
-
36
-
37
-
38
-
39
-
40
-
41
-
42
-
43
-
 44
44 -
 45
45 -
 46
46 -
 47
47 -
 48
48 -
 49
49 -
 50
50 -
 51
51 -
 52
52 -
 53
53 -
 54
54 -
 55
55 -
 56
56 -
 57
57 -
 58
58 -
 59
59 -
 60
60 -
 61
61 -
 62
62 -
 63
63 -
 64
64 -
65
-
66
-
67
-
68
-
69
-
70
-
71
-
72
-
73
-
74
-
75
-
76
-
77
-
78
-
79
-
80
-
81
-
82
-
83
-
84
-
85
-
86
-
87
-
88
-
89
-
90
-
91
-
92
-
93
-
94
-
95
-
96
-
97
-
98
-
99
-
100
-
101
-
102
-
103
-
104
-
105
-
106
-
107
-
108
-
109
-
110
-
111
-
112
-
113
-
114
-
115
-
116
-
117
-
118
-
119
-
120
-
121
-
122
-
123
-
124
-
125
-
126
-
127
-
128
-
129
-
130
-
131
-
132
-
133
-
134
-
135
-
136
-
137
-
138
-
139
-
140
-
141
-
142
-
143
-
144
-
145
-
146
-
147
-
148
-
149
-
150
-
151
-
152
-
153
-
154
-
155
-
156
-
157
-
158
-
159
-
160
-
161
-
162
-
163
-
164
-
165
-
166
-
167
-
168
-
169
-
170
-
171
-
172
-
173
-
174
-
175
-
176
-
177
-
178
-
179
-
180
-
181
-
182
-
183
-
184
-
185
-
186
 |
 |

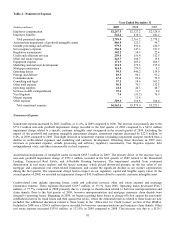
deteriorating asset quality conditions in the residential related and wholesale portfolios. We expect net charge-offs and the
provision for loan losses to remain at elevated levels until we experience a sustained improvement in the credit quality of the
loan portfolio. The amount of future growth in the ALLL is highly correlated to unemployment levels, changes in home
prices within our markets, especially Florida, as well as sustained improvement in our portfolio-specific credit quality
indicators. See additional discussion of our expectations for future levels of credit quality in the “Allowance for Credit
Losses” and “Nonperforming Assets” sections of this MD&A.
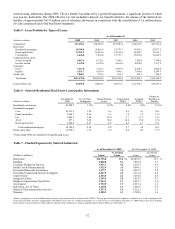
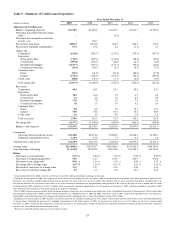
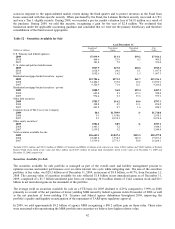
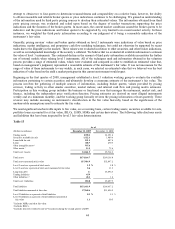
Table 10 - Nonperforming Assets
As of December 31
(Dollars in millions) 2009 2008 2007 2006 2005
Nonperforming Assets
Nonaccrual/nonperforming loans:
Commercial $484.0 $322.0 $74.5 $106.8 $70.9
Real estate:
Construction 1,484.6 1,276.8 295.3 38.6 24.4
Residential mortgages 2,715.9 1,847.0 841.4 266.0 95.7
Home equity lines 289.0 272.6 135.7 13.5 7.6
Commercial real estate 391.8 176.6 44.5 55.4 44.6
Consumer loans 37.3 45.0 39.0 23.5 28.7
Total nonaccrual/nonperforming loans 5,402.6 3,940.0 1,430.4 503.8 271.9
Other real estate owned 1619.6 500.5 183.7 55.4 30.7
Other repossessed assets 79.1 15.9 11.5 6.6 7.2
Total nonperforming assets $6,101.3 $4,456.4 $1,625.6 $565.8 $309.8
Ratios:
Nonperforming loans to total loans 4.75 % 3.10 % 1.17 % 0.41 % 0.24 %
Nonperforming assets to total loans plus
OREO and other repossessed assets 5.33 3.49 1.33 0.47 0.27
Restructured loans (accruing) $1,640.9 $462.6 $29.9 $28.0 $24.4
Accruing loans past due 90 days or more 1,499.9 1,032.3 611.0 351.5 371.5
1Does not include foreclosed real estate related to loans previously serviced for GNMA reported in other assets and insured by FHA and VA as to principal
and interest.
Nonperforming Assets
Nonperforming assets totaled $6.1 billion as of December 31, 2009, an increase of $1.6 billion, or 36.9%, from December 31,
2008. Nonperforming loans as of December 31, 2009 were $5.4 billion, an increase of $1.5 billion, or 37.1%, from
December 31, 2008. Of this total increase, nonperforming residential mortgage loans represented $868.9 million, commercial
real estate loans represented $215.2 million, real estate construction loans represented $207.8 million, commercial loans
represented $162.0 million, and home equity lines represented $16.4 million. We experienced slight declines in total
nonperforming assets and total nonperforming loans over the last six months of 2009 as well as a decline in early stage
delinquencies. The slight decline in total nonperforming loans was primarily related to commercial and construction loans,
partially offset by increases in residential mortgages and commercial real estate loans.
Of the $5.4 billion in nonaccruing loans, approximately 80% is related to residential real estate. Residential mortgages and
home equity lines represent 55.6% of total nonaccruals. The increase in nonperforming assets is largely related to the housing
correction and related decline in the values of residential real estate. The nonperforming assets are also affected by the time it
takes to complete the foreclosure process, especially in judicial jurisdictions. The asset quality of the residential mortgage
portfolio showed signs of stabilization and moderating growth in nonperforming loans during the fourth quarter, although on
an absolute basis, this portfolio continues to perform poorly. We have noted an increase in the amount of time it takes us to
foreclose upon residential real estate collateral in certain states, primarily Florida, which we believe is primarily due to
delays in the judicial foreclosure process. We apply rigorous loss mitigation processes to these nonperforming loans to
ensure that the asset value is preserved to the greatest extent possible; despite these efforts, it is likely we will realize
additional losses on these nonperforming assets in the future.
Nonperforming residential mortgages are primarily collateralized by one-to-four family residential properties. Approximately
84% of the nonperforming loans relate to properties in our footprint; approximately 52% of such nonperforming loans are in
Florida. Approximately 75% of the nonperforming residential mortgages have been on nonaccrual status for at least six
months. We have reached a point where growth in residential mortgage nonperforming loans has slowed as we are
approaching the equilibrium point where the nonperforming loan outflow from foreclosures is offsetting the inflow from new
nonperforming loans. Approximately 52% of the nonperforming home equity lines were from lines originated by third
parties, lines in Florida with combined LTVs greater than 80%, or lines in other states with combined LTVs greater than
90%. Beginning in 2006, we tightened the underwriting standards applicable to many of the residential loan products offered.
Nonaccrual construction loans were $1.5 billion, an increase of $207.8 million, or 16.3%, from December 31, 2008.
Approximately 90% of the nonperforming construction loans are secured by residential real estate; specifically, $261 million
38