SunTrust 2009 Annual Report Download - page 39
Download and view the complete annual report
Please find page 39 of the 2009 SunTrust annual report below. You can navigate through the pages in the report by either clicking on the pages listed below, or by using the keyword search tool below to find specific information within the annual report.-
 1
1 -
2
-
3
-
4
-
5
-
6
-
7
-
8
-
9
-
10
-
11
-
12
-
13
-
14
-
15
-
16
-
17
-
18
-
19
-
20
-
21
-
22
-
23
-
24
-
25
-
26
-
27
-
28
-
 29
29 -
 30
30 -
 31
31 -
 32
32 -
 33
33 -
 34
34 -
 35
35 -
 36
36 -
 37
37 -
 38
38 -
 39
39 -
 40
40 -
 41
41 -
 42
42 -
 43
43 -
 44
44 -
 45
45 -
 46
46 -
 47
47 -
 48
48 -
 49
49 -
50
-
51
-
52
-
53
-
54
-
55
-
56
-
57
-
58
-
59
-
60
-
61
-
62
-
63
-
64
-
65
-
66
-
67
-
68
-
69
-
70
-
71
-
72
-
73
-
74
-
75
-
76
-
77
-
78
-
79
-
80
-
81
-
82
-
83
-
84
-
85
-
86
-
87
-
88
-
89
-
90
-
91
-
92
-
93
-
94
-
95
-
96
-
97
-
98
-
99
-
100
-
101
-
102
-
103
-
104
-
105
-
106
-
107
-
108
-
109
-
110
-
111
-
112
-
113
-
114
-
115
-
116
-
117
-
118
-
119
-
120
-
121
-
122
-
123
-
124
-
125
-
126
-
127
-
128
-
129
-
130
-
131
-
132
-
133
-
134
-
135
-
136
-
137
-
138
-
139
-
140
-
141
-
142
-
143
-
144
-
145
-
146
-
147
-
148
-
149
-
150
-
151
-
152
-
153
-
154
-
155
-
156
-
157
-
158
-
159
-
160
-
161
-
162
-
163
-
164
-
165
-
166
-
167
-
168
-
169
-
170
-
171
-
172
-
173
-
174
-
175
-
176
-
177
-
178
-
179
-
180
-
181
-
182
-
183
-
184
-
185
-
186
 |
 |
While 2009 was a year of poor credit performance as most notably evidenced by our higher allowance for loan losses,
provision for credit losses, net charge-offs, and nonperforming assets, asset quality trends improved in the final quarter of
2009 when compared to the previous quarter as evidenced by the decline in credit losses and early stage delinquencies and
stabilization of nonperforming loans. In addition, our reserve build decreased during each consecutive quarter during the year
with the fourth quarter allowance for loan losses having increased by only 3.2% from the prior quarter. However, absolute
asset quality issues remain centered in the residential real estate-related portfolios, including residential mortgages, home
equity products, and residential construction. In addition, we experienced some weakness in our commercial client base,
particularly those in more cyclically sensitive industries, and in our small business portfolio, and we expect that we will
continue to see stress in asset quality in the commercial portfolio. The $1.7 billion increase in net charge-offs during the year
was primarily related to residential mortgages, large corporate borrowers in economically cyclical industries, and the
resolution of loan workouts related to the home builder portfolio. Our nonperforming loans grew by $1.5 billion during 2009,
which is a result of the economic environment causing increased client defaults on their loans and extended disposition times
on our consumer loans secured by residential real estate. Given the extended timelines to foreclose, especially in Florida, we
expect that our nonperforming loan levels will remain elevated throughout 2010. However, during the second half of 2009,
the level of increases in nonperforming loans moderated as compared to the increases seen during the first six months of the
year. This moderation in nonperforming loans, the first since the credit crisis began in 2007, was mainly due to a reduction in
nonaccrual commercial loans as the result of charge-offs recognized during the second half of the year and the transfer of
certain commercial loans out of nonaccrual due to improved performance. We have implemented numerous loss mitigation
efforts and are working to effectively manage elevated levels of nonperforming loans. While not a primary driver of the
improvement, our proactive mortgage loan modification programs have had a positive influence on these delinquency and
nonperforming loan trends. We have seen a $1.2 billion increase in accruing restructured loans during 2009, which is due to
us taking proactive steps to responsibly modify loans in order to mitigate loss exposure related to borrowers experiencing
financial difficulty. We are aggressively pursuing modifications when there is a reasonable chance that the modification will
allow the client to continue to remain in their home. Although, when there has been a loss of income such that the client
cannot reasonably support even a modified loan, we are strongly encouraging short sales and deed-in-lieu arrangements and
relocation to more affordable housing. See additional discussion of credit and asset quality in the “Loans”, “Allowance for
Credit Losses”, “Provision for Credit Losses”, and “Nonperforming Assets” sections of this MD&A.
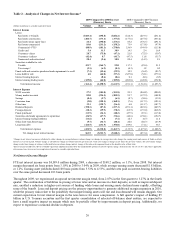
Despite the net losses in 2009, our capital and liquidity positions are stronger at the end of 2009 compared to prior year as
evidenced by the growth during the year in our capital and liquidity ratios and growth in deposits. Our Tier 1 common equity
ratio improved to 7.67% from 5.83% at December 31, 2008. In addition, our Tier 1 capital ratio increased to 12.96% which is
a 209 basis point increase from 10.87% at December 31, 2008. These improvements were the result of the capital raising
transactions during the second quarter of 2009, as well as lower risk weighted assets from a reduction in loans and unfunded
commitments. We also have substantial available liquidity as the inflows of high quality deposits have largely been retained
in cash and invested in high quality government-backed securities. See additional discussion of our capital and liquidity
position in the “Capital Resources” and “Liquidity Risk” sections of this MD&A.
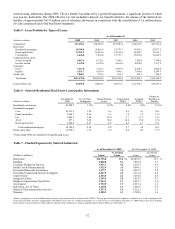
During the year, we experienced a significant increase in consumer and commercial deposits as evidenced by an 11.7%
increase in average deposits compared to the prior year. Growth has occurred in all deposit products with money market and
DDAs comprising the majority of the increase. This record level of deposits was driven by the industry-wide trend of clients
seeking the security of bank deposits; however, we believe our improved products and pricing, enhanced client service, and
the “Live Solid. Bank Solid.” brand advertising specifically assisted us in attracting new clients and expanding existing
relationships. Further, through an intense focus on improved execution, we have been successful in improving client
satisfaction, acquisition, and retention. Additionally, as a result of the increase in these core deposits, we have been able to
reduce our exposure to foreign deposits and higher-cost brokered deposits by $2.5 billion, or 31.0%, since December 31,
2008 as well as higher-cost long-term debt by $9.3 billion, or 34.8%, over this same period. While we witnessed solid growth
in core deposits during 2009, it has moderated during the latter part of the year, causing us to believe that it may further
moderate going forward as the economy improves. Despite the moderation in total deposit growth, the mix of deposits
continues to shift towards lower cost transaction accounts.
During the year, average loans declined $4.4 billion, or 3.5%, and total loans at December 31, 2009 were down 10.5% from
prior year. Our aggressive effort to reduce exposure to construction lending, as evidenced by the 44.7% decline in average
balances versus the previous year, was a primary driver of the decline in average loans during the year. In addition, we
reduced our exposure to residential real estate loans as evidenced by the $3.0 billion, or 9.4%, decrease in average residential
real estate loans in 2009. The decline in the remaining loan categories is primarily due to weak loan demand as a result of the
economic environment, which has caused clients to be focused on capital preservation and an allocation of excess funds for
debt reduction. The trend of declining line of credit utilization among our mid-size and larger corporate clients continued due
to improved access to capital markets and lower working capital needs. We remain focused on extending credit to qualified
borrowers as businesses and consumers work through the current economic downturn. Despite the reduction in our overall
loan portfolio, new loan originations, commitments, and renewals of commercial and consumer loans were approximately
$90 billion during 2009, with residential mortgage originations leading the way.
23