SunTrust 2009 Annual Report Download - page 123
Download and view the complete annual report
Please find page 123 of the 2009 SunTrust annual report below. You can navigate through the pages in the report by either clicking on the pages listed below, or by using the keyword search tool below to find specific information within the annual report.-
 1
1 -
2
-
3
-
4
-
5
-
6
-
7
-
8
-
9
-
10
-
11
-
12
-
13
-
14
-
15
-
16
-
17
-
18
-
19
-
20
-
21
-
22
-
23
-
24
-
25
-
26
-
27
-
28
-
29
-
30
-
31
-
32
-
33
-
34
-
35
-
36
-
37
-
38
-
39
-
40
-
41
-
42
-
43
-
44
-
45
-
46
-
47
-
48
-
49
-
50
-
51
-
52
-
53
-
54
-
55
-
56
-
57
-
58
-
59
-
60
-
61
-
62
-
63
-
64
-
65
-
66
-
67
-
68
-
69
-
70
-
71
-
72
-
73
-
74
-
75
-
76
-
77
-
78
-
79
-
80
-
81
-
82
-
83
-
84
-
85
-
86
-
87
-
88
-
89
-
90
-
91
-
92
-
93
-
94
-
95
-
96
-
97
-
98
-
99
-
100
-
101
-
102
-
103
-
104
-
105
-
106
-
107
-
108
-
109
-
110
-
111
-
112
-
 113
113 -
 114
114 -
 115
115 -
 116
116 -
 117
117 -
 118
118 -
 119
119 -
 120
120 -
 121
121 -
 122
122 -
 123
123 -
 124
124 -
 125
125 -
 126
126 -
 127
127 -
 128
128 -
 129
129 -
 130
130 -
 131
131 -
 132
132 -
 133
133 -
134
-
135
-
136
-
137
-
138
-
139
-
140
-
141
-
142
-
143
-
144
-
145
-
146
-
147
-
148
-
149
-
150
-
151
-
152
-
153
-
154
-
155
-
156
-
157
-
158
-
159
-
160
-
161
-
162
-
163
-
164
-
165
-
166
-
167
-
168
-
169
-
170
-
171
-
172
-
173
-
174
-
175
-
176
-
177
-
178
-
179
-
180
-
181
-
182
-
183
-
184
-
185
-
186
 |
 |

SUNTRUST BANKS, INC.
Notes to Consolidated Financial Statements (Continued)
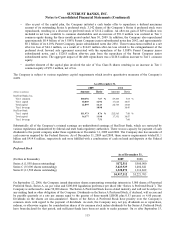
subordinated securities. To estimate the market value of these securities, consideration was given to dealer indications of
market value as well as the results of discounted cash flow models using market assumptions for prepayment rates, credit
losses and discount rates due to illiquidity in the market for non-agency residential MBS.
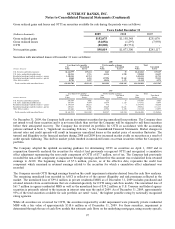
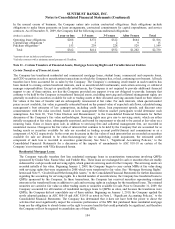
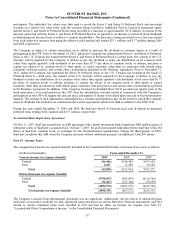
December 31, 2009
(Dollars in millions)
Residential
Mortgage Student Loans CDO Securities Total
Fair Value $216.7 $18.5 $25.5 $260.7
Prepayment Rate 11.4% - 17% 5.9% 0%
Decline in fair value from 10% adverse change 5.4 0.2 - 5.6
Decline in fair value from 20% adverse change 9.9 0.6 - 10.5
Expected Credit Losses 0.26% - 21% nm 33.7% -38.4%
Decline in fair value from 10% adverse change 2.6 nm - 2.6
Decline in fair value from 20% adverse change 4.3 nm - 4.3
Annual Discount Rate 5% - 450% 22.5% 25.8% - 27.7%
Decline in fair value from 10% adverse change 6.6 0.6 2.7 9.9
Decline in fair value from 20% adverse change 12.2 1.3 5.1 18.6
Weighted Average Life (in years) 4.14 - 16.7 4.92 24.22
Expected Static Pool Losses 0.26% - 28.6% nm 33.7% - 38.4%
“nm”- not meaningful.
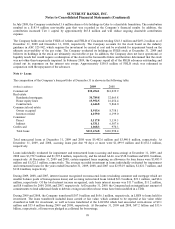
At December 31, 2008, the total fair value of retained interests, excluding MSRs, was approximately $367.0 million. The
weighted average remaining lives of the Company’s retained interests ranged from approximately 2.5 years to 18 years for
interests in residential mortgage loans, commercial and corporate loans, and student loans as of December 31, 2008, with the
weighted average remaining life of interests in CDO securities approximating 24 years. To estimate the fair values of these
securities, consideration was given to dealer indications of market value, where applicable, as well as the results of
discounted cash flow models using key assumptions and inputs for prepayment rates, credit losses, and discount rates. For the
majority of the retained interests, the Company has considered the impacts on the fair values of two unfavorable variations
from the estimated amounts, related to the fair values of the Company’s retained and residual interests, excluding MSRs.
Declines in fair values for the total retained interests due to 10% and 20% adverse changes in the key assumptions and inputs
totaled approximately $22.2 million and $45.7 million, respectively, as of December 31, 2008. For certain subordinated
retained interests in residential mortgage securitizations, the Company used dealer indicated prices, as the Company believed
these price indications more accurately reflected the severe disruption in the market for these securities. As such, the
Company has not evaluated any adverse changes in key assumptions of these values. As of December 31, 2008, the fair value
of these subordinated interests was $4.4 million based on a weighted average price of 12.3% of par. Expected static pool
losses were approximately 5% or less for residential mortgage loans and commercial and corporate loans, as of December 31,
2008. For interests related to securitizations of CDO securities, expected static pool losses ranged from approximately 23%
to 31% as of December 31, 2008.
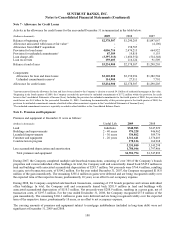
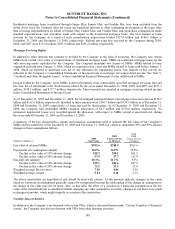
Portfolio balances and delinquency balances based on 90 days or more past due (including accruing and nonaccrual loans) as
of December 31, 2009 and December 31, 2008, and net charge-offs related to managed portfolio loans (both those that are
owned by the Company and those that have been transferred) for years ended December 31, 2009 and 2008 are as follows:
Principal Balance Past Due Net Charge-offs
(Dollars in millions) 2009 2008 2009 2008 2009 2008
Type of loan:
Commercial $32,494.1 $41,039.9 $507.8 $340.9 $572.4 $194.6
Residential mortgage and home equity 46,742.3 48,520.2 4,064.6 2,727.6 1,902.6 950.5
Commercial real estate and construction 21,721.2 24,821.1 1,901.7 1,492.6 527.2 215.2
Consumer 11,648.9 11,646.9 428.4 411.1 152.1 172.4
Credit card 1,068.3 970.3 --83.4 31.6
Total loan portfolio $113,674.8 $126,998.4 $6,902.5 $4,972.2 $3,237.7 $1,564.3
Managed securitized loans
Commercial 3,460.2 3,766.8 64.5 30.2 27.9 -
Residential mortgage 1,482.3 1,836.2 122.9 129.5 44.2 24.7
Other 506.1 565.2 25.1 61.6 0.4 0.3
Total managed loans $119,123.4 $133,166.6 $7,115.0 $5,193.5 $3,310.2 $1,589.3
107