SunTrust 2009 Annual Report Download - page 162
Download and view the complete annual report
Please find page 162 of the 2009 SunTrust annual report below. You can navigate through the pages in the report by either clicking on the pages listed below, or by using the keyword search tool below to find specific information within the annual report.-
 1
1 -
2
-
3
-
4
-
5
-
6
-
7
-
8
-
9
-
10
-
11
-
12
-
13
-
14
-
15
-
16
-
17
-
18
-
19
-
20
-
21
-
22
-
23
-
24
-
25
-
26
-
27
-
28
-
29
-
30
-
31
-
32
-
33
-
34
-
35
-
36
-
37
-
38
-
39
-
40
-
41
-
42
-
43
-
44
-
45
-
46
-
47
-
48
-
49
-
50
-
51
-
52
-
53
-
54
-
55
-
56
-
57
-
58
-
59
-
60
-
61
-
62
-
63
-
64
-
65
-
66
-
67
-
68
-
69
-
70
-
71
-
72
-
73
-
74
-
75
-
76
-
77
-
78
-
79
-
80
-
81
-
82
-
83
-
84
-
85
-
86
-
87
-
88
-
89
-
90
-
91
-
92
-
93
-
94
-
95
-
96
-
97
-
98
-
99
-
100
-
101
-
102
-
103
-
104
-
105
-
106
-
107
-
108
-
109
-
110
-
111
-
112
-
113
-
114
-
115
-
116
-
117
-
118
-
119
-
120
-
121
-
122
-
123
-
124
-
125
-
126
-
127
-
128
-
129
-
130
-
131
-
132
-
133
-
134
-
135
-
136
-
137
-
138
-
139
-
140
-
141
-
142
-
143
-
144
-
145
-
146
-
147
-
148
-
149
-
150
-
151
-
 152
152 -
 153
153 -
 154
154 -
 155
155 -
 156
156 -
 157
157 -
 158
158 -
 159
159 -
 160
160 -
 161
161 -
 162
162 -
 163
163 -
 164
164 -
 165
165 -
 166
166 -
 167
167 -
 168
168 -
 169
169 -
 170
170 -
 171
171 -
 172
172 -
173
-
174
-
175
-
176
-
177
-
178
-
179
-
180
-
181
-
182
-
183
-
184
-
185
-
186
 |
 |

SUNTRUST BANKS, INC.
Notes to Consolidated Financial Statements (Continued)
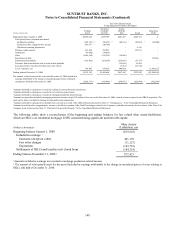
Fair Value Gain/(Loss) for the Year Ended
December 31, 2008, for Items Measured at Fair Value
Pursuant to Election of the Fair Value Option
(Dollars in thousands)
Trading Account
Profits and
Commissions
Mortgage
Production
Related
Income
Total
Changes in
Fair Values
Included in
Current-
Period
Earnings1
Assets
Trading assets ($6,598) $ - ($6,598)
Loans held for sale2- 268,386 268,386
Loans (4,195) (26,066) (30,261)
Liabilities
Brokered deposits 46,007 - 46,007
Long-term debt (65,322) - (65,322)
1Changes in fair value for the year ended December 31, 2008 exclude accrued interest for the period then ended. Interest income or
interest expense on trading assets, loans, loans held for sale, brokered deposits and long-term debt that have been elected to be carried at
fair value are recorded in interest income or interest expense in the Consolidated Statements of Income/(Loss) based on their contractual
coupons. Certain trading assets do not have a contractually stated coupon and, for these securities, the Company records interest income
based on the effective yield calculated upon acquisition of those securities.
2For the year ended December 31, 2008, these amounts include $467.1 million related to MSR assets recognized upon the sale of the
loans. These amounts exclude $18.5 million of MSRs recognized upon the sale of loans reported at the lower of cost or market value.
These MSRs are excluded from the table because neither the loans nor the related MSRs were reported at fair value on a recurring basis.
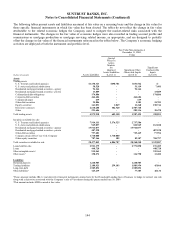
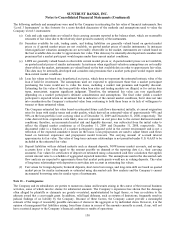
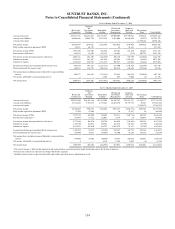
The following tables present the change in carrying value of those assets measured at fair value on a non-recurring basis, for
which impairment was recognized in the current period. The table does not reflect the change in fair value attributable to any
related economic hedges the Company may have used to mitigate the interest rate risk associated with LHFS and MSRs, nor
does it include information related to the goodwill impairment charge recorded during the year ended December 31, 2009
which is discussed in Note 9, “Goodwill and Other Intangible Assets”, to the Consolidated Financial Statements. The
Company’s economic hedging activities for LHFS and MSRs are deployed at the portfolio level.
Fair Value Measurement at
December 31, 2009, Using
(Dollars in thousands)
Net
Carrying
Value
Quoted Prices In
Active Markets
for Identical
Assets/Liabilities
(Level 1)
Significant
Other
Observable
Inputs
(Level 2)
Significant
Unobservable
Inputs
(Level 3)
Valuation
Allowance
Loans Held for Sale 1$1,339,324 $- $1,173,310 $166,014 ($48,204)
MSRs 223,342 - - 23,342 (6,718)
OREO 3619,621 - 495,827 123,794 (110,458)
Affordable Housing 4395,213 - - 395,213 -
Loans 596,062 - 96,062 - (15,607)
Other Assets 6143,600 - 60,852 82,748 -
1These balances are measured at the lower of cost or market.
2MSRs carried at amortized cost are stratified for the purpose of impairment testing with impaired amounts presented herein.
3OREO is recorded at the lower of cost or fair value, less costs to sell.
4Affordable housing was impacted by $46.8 million in impairment charges recorded during the year ended December 31, 2009.
5These balances are measured at fair value on a non-recurring basis using the fair value of the underlying collateral.
6These assets include equity partner investments, structured leasing products, and other repossessed assets. These assets were impacted by $26.3 million in
impairment charges recorded during the year ended December 31, 2009.
146