SunTrust 2009 Annual Report Download - page 42
Download and view the complete annual report
Please find page 42 of the 2009 SunTrust annual report below. You can navigate through the pages in the report by either clicking on the pages listed below, or by using the keyword search tool below to find specific information within the annual report.-
 1
1 -
2
-
3
-
4
-
5
-
6
-
7
-
8
-
9
-
10
-
11
-
12
-
13
-
14
-
15
-
16
-
17
-
18
-
19
-
20
-
21
-
22
-
23
-
24
-
25
-
26
-
27
-
28
-
29
-
30
-
31
-
 32
32 -
 33
33 -
 34
34 -
 35
35 -
 36
36 -
 37
37 -
 38
38 -
 39
39 -
 40
40 -
 41
41 -
 42
42 -
 43
43 -
 44
44 -
 45
45 -
 46
46 -
 47
47 -
 48
48 -
 49
49 -
 50
50 -
 51
51 -
 52
52 -
53
-
54
-
55
-
56
-
57
-
58
-
59
-
60
-
61
-
62
-
63
-
64
-
65
-
66
-
67
-
68
-
69
-
70
-
71
-
72
-
73
-
74
-
75
-
76
-
77
-
78
-
79
-
80
-
81
-
82
-
83
-
84
-
85
-
86
-
87
-
88
-
89
-
90
-
91
-
92
-
93
-
94
-
95
-
96
-
97
-
98
-
99
-
100
-
101
-
102
-
103
-
104
-
105
-
106
-
107
-
108
-
109
-
110
-
111
-
112
-
113
-
114
-
115
-
116
-
117
-
118
-
119
-
120
-
121
-
122
-
123
-
124
-
125
-
126
-
127
-
128
-
129
-
130
-
131
-
132
-
133
-
134
-
135
-
136
-
137
-
138
-
139
-
140
-
141
-
142
-
143
-
144
-
145
-
146
-
147
-
148
-
149
-
150
-
151
-
152
-
153
-
154
-
155
-
156
-
157
-
158
-
159
-
160
-
161
-
162
-
163
-
164
-
165
-
166
-
167
-
168
-
169
-
170
-
171
-
172
-
173
-
174
-
175
-
176
-
177
-
178
-
179
-
180
-
181
-
182
-
183
-
184
-
185
-
186
 |
 |

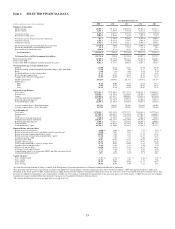
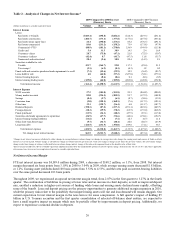
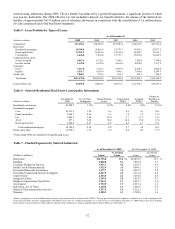
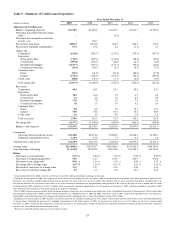
Table 2 - Analysis of Changes in Net Interest Income 1
2009 Compared to 2008 Increase
(Decrease) Due to
2008 Compared to 2007 Increase
(Decrease) Due to
(Dollars in millions on a taxable-equivalent basis) Volume Rate Net Volume Rate Net
Interest Income
Loans:
Real estate 1-4 family ($183.4) ($98.8) ($282.2) ($12.3) ($19.3) ($31.6)
Real estate construction (204.7) (173.1) (377.8) (177.6) (257.6) (435.2)
Real estate home equity lines 24.4 (298.0) (273.6) 85.2 (376.5) (291.3)
Real estate commercial 83.0 (233.2) (150.2) 75.9 (173.8) (97.9)
Commercial - FTE2(88.9) (181.1) (270.0) 236.9 (349.9) (113.0)
Credit card 5.4 33.5 38.9 14.5 2.4 16.9
Consumer - direct 28.7 (75.8) (47.1) 21.8 (72.5) (50.7)
Consumer - indirect (42.4) 0.7 (41.7) (47.5) 11.8 (35.7)
Nonaccrual and restructured 20.4 (9.6) 10.8 22.4 (14.3) 8.1
Securities available for sale:
Taxable 323.7 (264.7) 59.0 117.3 (25.4) 91.9
Tax-exempt 2(2.1) (6.2) (8.3) (0.3) 1.2 0.9
Funds sold and securities purchased under agreements to resell (7.3) (15.6) (22.9) 12.5 (36.2) (23.7)
Loans held for sale 6.8 (64.0) (57.2) (327.0) (52.1) (379.1)
Interest-bearing deposits - (0.6) (0.6) 0.1 (0.6) (0.5)
Interest earning trading assets (125.0) (64.0) (189.0) (203.0) (149.8) (352.8)
Total interest income (161.4) (1,450.5) (1,611.9) (181.1) (1,512.6) (1,693.7)
Interest Expense
NOW accounts 27.2 (181.0) (153.8) 23.3 (244.2) (220.9)
Money market accounts 89.0 (294.5) (205.5) 95.7 (197.9) (102.2)
Savings (0.4) (5.7) (6.1) (8.7) (30.6) (39.3)
Consumer time (2.0) (158.1) (160.1) (7.6) (117.5) (125.1)
Other time 32.3 (128.7) (96.4) 6.0 (113.7) (107.7)
Brokered deposits (150.1) (87.2) (237.3) (251.1) (218.6) (469.7)
Foreign deposits (38.3) (39.9) (78.2) (63.5) (155.0) (218.5)
Funds purchased (13.9) (34.3) (48.2) (27.9) (87.1) (115.0)
Securities sold under agreements to repurchase (26.9) (47.7) (74.6) (44.6) (150.1) (194.7)
Interest-bearing trading liabilities (11.6) 4.5 (7.1) 12.3 (0.7) 11.6
Other short-term borrowings (5.7) (34.7) (40.4) 22.8 (88.7) (65.9)
Long-term debt (124.5) (231.5) (356.0) 109.8 (71.1) 38.7
Total interest expense (224.9) (1,238.8) (1,463.7) (133.5) (1,475.2) (1,608.7)
Net change in net interest income $63.5 ($211.7) ($148.2) ($47.6) ($37.4) ($85.0)
1Changes in net interest income are attributed to either changes in average balances (volume change) or changes in average rates (rate change) for earning assets and sources of funds on which
interest is received or paid. Volume change is calculated as change in volume times the previous rate, while rate change is change in rate times the previous volume. The rate/volume change,
change in rate times change in volume, is allocated between volume change and rate change at the ratio each component bears to the absolute value of their total.
2Interest income includes the effects of taxable-equivalent adjustments (reduced by the nondeductible portion of interest expense) using a federal income tax rate of 35% and, where applicable,
state income taxes to increase tax-exempt interest income to a taxable-equivalent basis.
Net Interest Income/Margin
FTE net interest income was $4,589.0 million during 2009, a decrease of $148.2 million, or 3.1%, from 2008. Net interest
margin decreased six basis points from 3.10% in 2008 to 3.04% in 2009, while average earning assets decreased $1.8 billion,
or 1.2%. Earning asset yields declined 100 basis points from 5.53% to 4.53%, and the rates paid on interest-bearing liabilities
over the same period decreased 103 basis points.
Throughout 2009, we experienced an upward net interest margin trend, from 2.87% in the first quarter to 3.27% in the fourth
quarter. The combination of liabilities re-pricing at lower rates and an increase in client deposits, as well as improved deposit
mix, enabled a reduction in higher-cost sources of funding while loans and earning assets declined more rapidly, offsetting
some of the benefit. Loan and deposit pricing are the primary opportunities to generate additional margin expansion in 2010,
while the primary risks relate to the possibility that nonperforming assets will rise and loan demand will remain sluggish. Our
current expectation for net interest margin in the near-term is for some compression. A full quarter’s impact of holding $5
billion in U.S. Treasury securities and the first quarter consolidation of selected off-balance sheet entities, are expected to
have a small negative impact on margin which may be partially offset by improvements in deposit pricing. Additionally, we
expect to experience a seasonal decline in deposits.
26