SunTrust 2009 Annual Report Download - page 130
Download and view the complete annual report
Please find page 130 of the 2009 SunTrust annual report below. You can navigate through the pages in the report by either clicking on the pages listed below, or by using the keyword search tool below to find specific information within the annual report.-
 1
1 -
2
-
3
-
4
-
5
-
6
-
7
-
8
-
9
-
10
-
11
-
12
-
13
-
14
-
15
-
16
-
17
-
18
-
19
-
20
-
21
-
22
-
23
-
24
-
25
-
26
-
27
-
28
-
29
-
30
-
31
-
32
-
33
-
34
-
35
-
36
-
37
-
38
-
39
-
40
-
41
-
42
-
43
-
44
-
45
-
46
-
47
-
48
-
49
-
50
-
51
-
52
-
53
-
54
-
55
-
56
-
57
-
58
-
59
-
60
-
61
-
62
-
63
-
64
-
65
-
66
-
67
-
68
-
69
-
70
-
71
-
72
-
73
-
74
-
75
-
76
-
77
-
78
-
79
-
80
-
81
-
82
-
83
-
84
-
85
-
86
-
87
-
88
-
89
-
90
-
91
-
92
-
93
-
94
-
95
-
96
-
97
-
98
-
99
-
100
-
101
-
102
-
103
-
104
-
105
-
106
-
107
-
108
-
109
-
110
-
111
-
112
-
113
-
114
-
115
-
116
-
117
-
118
-
119
-
 120
120 -
 121
121 -
 122
122 -
 123
123 -
 124
124 -
 125
125 -
 126
126 -
 127
127 -
 128
128 -
 129
129 -
 130
130 -
 131
131 -
 132
132 -
 133
133 -
 134
134 -
 135
135 -
 136
136 -
 137
137 -
 138
138 -
 139
139 -
 140
140 -
141
-
142
-
143
-
144
-
145
-
146
-
147
-
148
-
149
-
150
-
151
-
152
-
153
-
154
-
155
-
156
-
157
-
158
-
159
-
160
-
161
-
162
-
163
-
164
-
165
-
166
-
167
-
168
-
169
-
170
-
171
-
172
-
173
-
174
-
175
-
176
-
177
-
178
-
179
-
180
-
181
-
182
-
183
-
184
-
185
-
186
 |
 |

SUNTRUST BANKS, INC.
Notes to Consolidated Financial Statements (Continued)
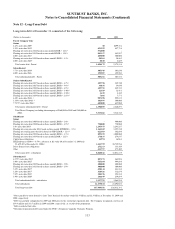
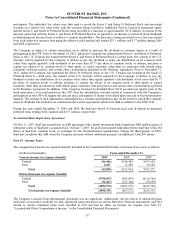
Maturities of long-term debt are: 2010 – $2,142.5 million; 2011 – $4,548.8 million; 2012 – $2,982.6 million; 2013 – $633.9
million; 2014 – $25.3 million; and thereafter—$7,156.4 million. Restrictive provisions of several long-term debt agreements
prevent the Company from creating liens on, disposing of, or issuing (except to related parties) voting stock of subsidiaries.
Further, there are restrictions on mergers, consolidations, certain leases, sales or transfers of assets, minimum shareholders’
equity, and maximum borrowings by the Company. As of December 31, 2009, the Company was in compliance with all
covenants and provisions of long-term debt agreements. As currently defined by federal bank regulators, long-term debt of
$2,356.4 million and $2,847.3 million as of December 31, 2009 and 2008, respectively, qualified as Tier 1 capital and long-
term debt of $2,817.9 million and $3,008.3 million as of December 31, 2009 and 2008, respectively, qualified as Tier 2
capital. As of December 31, 2009, the Company had collateral pledged to the FHLB of Atlanta to support $7.2 billion of
available borrowing capacity.
The Company does not consolidate certain wholly-owned trusts which had been formed for the sole purpose of issuing trust
preferred securities. The proceeds from the trust preferred securities issuances were invested in junior subordinated
debentures of the Parent Company. The obligations of these debentures constitute a full and unconditional guarantee by the
Parent Company of the trust preferred securities.
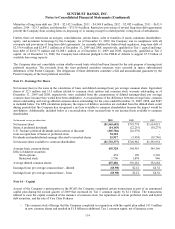
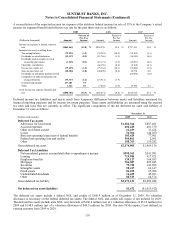
Note 13 - Earnings Per Share
Net income/(loss) is the same in the calculation of basic and diluted earnings/(loss) per average common share. Equivalent
shares of 32.5 million and 33.5 million related to common stock options and common stock warrants outstanding as of
December 31, 2009 and 2008, respectively, were excluded from the computations of diluted earnings/(loss) per average
common share because they would have been antidilutive. A reconciliation of the difference between average basic common
shares outstanding and average diluted common shares outstanding for the years ended December 31, 2009, 2008, and 2007
is included below. For EPS calculation purposes, the impact of dilutive securities are excluded from the diluted share count
during periods that the Company has recognized a net loss available to common shareholders because the impact would be
anti-dilutive. Additionally, included below is a reconciliation of net income/(loss) to net income/(loss) available to common
shareholders.
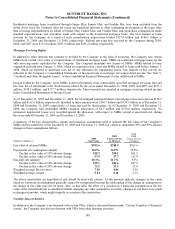
(In thousands, except per share data) 2009 2008 2007
Net income/(loss) ($1,563,683) $795,774 $1,634,015
Series A preferred dividends (14,143) (22,255) (30,275)
U.S. Treasury preferred dividends and accretion of discount (265,786) (26,579) -
Gain on repurchase of Series A preferred stock 94,318 --
Dividends and undistributed earnings allocated to unvested shares 15,917 (5,958) (10,786)
Net income/(loss) available to common shareholders ($1,733,377) $740,982 $1,592,954
Average basic common shares 435,328 348,919 349,346
Effect of dilutive securities:
Stock options 452 190 2,396
Restricted stock 1,706 1,074 946
Average diluted common shares 437,486 350,183 352,688
Earnings/(loss) per average common share - diluted ($3.98) $2.12 $4.52
Earnings/(loss) per average common share - basic ($3.98) $2.12 $4.56
Note 14 – Capital
As part of the Company’s participation in the SCAP, the Company completed certain transactions as part of an announced
capital plan during the second quarter of 2009 that increased its Tier 1 common equity by $2.1 billion. The transactions
utilized to raise the capital consisted of the issuance of common stock, the repurchase of certain preferred stock and hybrid
debt securities, and the sale of Visa Class B shares.
• The common stock offerings that the Company completed in conjunction with the capital plan added 141.9 million
in new common shares and resulted in $1.8 billion in additional Tier 1 common equity, net of issuance costs.
114