SunTrust 2009 Annual Report Download - page 63
Download and view the complete annual report
Please find page 63 of the 2009 SunTrust annual report below. You can navigate through the pages in the report by either clicking on the pages listed below, or by using the keyword search tool below to find specific information within the annual report.-
 1
1 -
2
-
3
-
4
-
5
-
6
-
7
-
8
-
9
-
10
-
11
-
12
-
13
-
14
-
15
-
16
-
17
-
18
-
19
-
20
-
21
-
22
-
23
-
24
-
25
-
26
-
27
-
28
-
29
-
30
-
31
-
32
-
33
-
34
-
35
-
36
-
37
-
38
-
39
-
40
-
41
-
42
-
43
-
44
-
45
-
46
-
47
-
48
-
49
-
50
-
51
-
52
-
 53
53 -
 54
54 -
 55
55 -
 56
56 -
 57
57 -
 58
58 -
 59
59 -
 60
60 -
 61
61 -
 62
62 -
 63
63 -
 64
64 -
 65
65 -
 66
66 -
 67
67 -
 68
68 -
 69
69 -
 70
70 -
 71
71 -
 72
72 -
 73
73 -
74
-
75
-
76
-
77
-
78
-
79
-
80
-
81
-
82
-
83
-
84
-
85
-
86
-
87
-
88
-
89
-
90
-
91
-
92
-
93
-
94
-
95
-
96
-
97
-
98
-
99
-
100
-
101
-
102
-
103
-
104
-
105
-
106
-
107
-
108
-
109
-
110
-
111
-
112
-
113
-
114
-
115
-
116
-
117
-
118
-
119
-
120
-
121
-
122
-
123
-
124
-
125
-
126
-
127
-
128
-
129
-
130
-
131
-
132
-
133
-
134
-
135
-
136
-
137
-
138
-
139
-
140
-
141
-
142
-
143
-
144
-
145
-
146
-
147
-
148
-
149
-
150
-
151
-
152
-
153
-
154
-
155
-
156
-
157
-
158
-
159
-
160
-
161
-
162
-
163
-
164
-
165
-
166
-
167
-
168
-
169
-
170
-
171
-
172
-
173
-
174
-
175
-
176
-
177
-
178
-
179
-
180
-
181
-
182
-
183
-
184
-
185
-
186
 |
 |

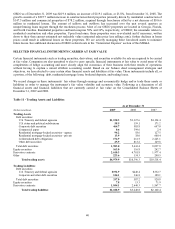
marketable. Of these amounts, $272.1 million during the year ended December 31, 2009, and $83.9 million during the
year ended December 31, 2008 were LHFS reported at fair value and will continue to be reported at fair value as loans
held for investment.
On May 1, 2008, we acquired 100% of the outstanding common shares of GB&T. We elected to account for $171.6
million of the acquired loans, which were classified as nonaccrual, at fair value. Upon acquisition, the loans had a fair
value of $111.1 million. These loans are primarily commercial real estate loans which do not trade in an active
secondary market, and as such, are considered level 3 instruments. As these loans are all classified as nonperforming,
cash proceeds from the sale of the underlying collateral is the expected source of repayment for the majority of these
loans. In order to fair value these loans, we utilized market data, when available, as well as internal assumptions, to
derive fair value estimates of the underlying collateral. During the year ended December 31, 2009, we recorded through
earnings a gain of $2.4 million on these loans compared to a loss of $4.2 million on these loans during the year ended
December 31, 2008. On December 31, 2009, primarily as a result of paydowns, payoffs, and transfers to OREO, the
loans had a fair value of $12.2 million.
Other Intangible Assets
We record MSRs at fair value on both a recurring and non-recurring basis. See Note 20, “Fair Value Election and
Measurement,” to the Consolidated Financial Statements for discussion of the valuation methodology, underlying
assumptions and validation procedures performed.
Other Assets/Liabilities, net
During the second quarter of 2009, in connection with our sale of Visa Class B shares, we entered into a derivative
contract whereby the ultimate cash payments received or paid, if any, under the contract are based on the ultimate
resolution of litigation involving Visa. The value of the derivative is estimated based on our expectations regarding the
ultimate resolution of that litigation, which involves a high degree of judgment and subjectivity. As a result, the value of
the derivative liability was classified as a level 3 instrument. See Note 18, “Reinsurance Arrangements and Guarantees”,
to the Consolidated Financial Statements for further discussion.
The fair value methodology and assumptions related to our IRLCs is described in Note 20, “Fair Value Election and
Measurement,” to the Consolidated Financial Statements.
Long-Term Debt
We elect to carry a portion of our publicly-issued, fixed rate debt at fair value. The debt consists of a number of
different issuances that carry coupon rates ranging from 5.00% to 7.75%, resulting in a weighted average rate of 5.93%,
and maturities from May 1, 2010 through April 1, 2020, resulting in a weighted average life of 4.9 years. During the
years ended December 31, 2009 and 2008, we recognized net losses of $153.0 million and net gains of $431.7 million,
respectively, in noninterest income associated with fair value changes in the debt and related derivatives and trading
securities that provide an economic offset to the change in the value of the debt.
Credit spreads widened throughout 2008 and the first quarter of 2009 in connection with the continued deterioration of
the broader financial markets and a number of failures in the financial services industry. However, credit spreads
tightened throughout the remainder of 2009 after the SCAP results were published and additional capital was raised.
Further fluctuations in our credit spreads are likely to occur in the future based on instrument specific and broader
market conditions. To mitigate the prospective impact of spread tightening, we completed the repurchase of
approximately $386.6 million of our publicly-traded long-term debt during the year ended December 31, 2008. No fair
value public debt was repurchased during the year ended December 31, 2009.
To mitigate the impact of fair value changes on our debt due to interest rate movement, we generally enter into interest
rate swaps; however, at times, we may also purchase fixed rate agency MBS to achieve this offset in interest rates.
There were no agency MBS held as of December 31, 2009 for this purpose.
We have historically used quotes from a third party pricing service as our primary source for valuation and have deemed
such quotes as reasonable estimates of fair value by utilizing broker quotes and/or institutional trading data, when
available, as corroborating evidence. Secondary trading activity had begun to increase in the first quarter of 2009 and
we observed continued increases in the volume and level of activity in the secondary markets through the fourth quarter
of 2009. In addition, we observed issuances in the primary markets of similar securities. Because we had a sufficient
amount of observable market pricing upon which to base our valuation, we utilized that data as the primary source for
valuing the fixed rate debt. Given that observable market data was used, we transferred our fixed rate debt out of level 3
as of the end of the second quarter.
47