SunTrust 2009 Annual Report Download - page 90
Download and view the complete annual report
Please find page 90 of the 2009 SunTrust annual report below. You can navigate through the pages in the report by either clicking on the pages listed below, or by using the keyword search tool below to find specific information within the annual report.
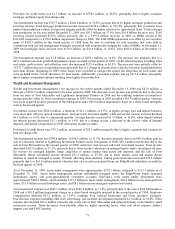
as lower gains from the sale of MSRs. The MSRs impairment was offset by $410.7 million of net gains from the sale of
available for sale securities that were held in conjunction with our risk management strategies associated with economically
hedging the value of MSRs.
Total noninterest expense increased $549.4 million, or 56.0%, driven by increased credit-related expenses. Operating losses
were up $311.7 million driven by fraud losses primarily related to borrower misrepresentation and insurance claim denials.
Reserves for mortgage reinsurance losses increased $179.8 million while other real estate expense and collection services
expense increased $110.8 million. Additionally, the recognition of loan origination costs resulting from our election to record
certain mortgage loans at fair value beginning in May 2007 increased noninterest expense compared with the prior year,
offsetting significant reductions in staff and commissions expense related to lower loan production.
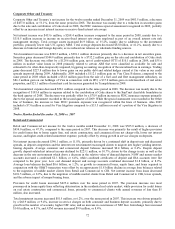
Wealth and Investment Management
Wealth and Investment Management’s net income for the twelve months ended December 31, 2008 was $174.4 million, an
increase of $87.3 million compared to same period in 2007. The following transactions represented $141.7 million of the
year-over-year increase:
• $39.4 million decrease due to the after-tax impact of the market valuation loss on Lehman bonds in the third
quarter of 2008.
• $18.4 million increase due to the after-tax gain on the sale of First Mercantile in the second quarter of 2008.
• $27.9 million decrease due to the after-tax impairment charge on a client-based intangible asset incurred in the
second quarter of 2008.
• $55.4 million increase due to the after-tax gain on sale of a minority interest in Lighthouse Investment Partners in
the first quarter of 2008.
• $155.3 million increase due to the after-tax impact of the market valuation losses in the fourth quarter of 2007 on
purchased securities.
• $20.1 million decrease due to the after-tax gain resulting from the sale upon merger of Lighthouse Partners into
Lighthouse Investment Partners in the first quarter of 2007.
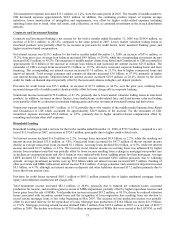
Net interest income decreased $30.1 million, or 8.5%, primarily due to a decline in deposit-related net interest income.
Average consumer and commercial deposits declined $0.3 billion, or 2.8%, while net interest income on deposits declined
$24.6 million, or 10.9%, due to the decrease in average balance, as well as a lower credit for funds on demand deposits.
Average loans increased $0.2 billion, or 2.6%, driven by growth in commercial loans in the professional specialty lending
units while net interest income dropped $4.6 million due to a $5.6 million decrease in consumer lending related net interest
income.
Provision for credit losses increased $18.4 million driven by higher home equity, personal credit line, and consumer
mortgage net charge-offs.
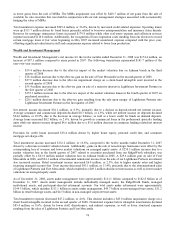
Total noninterest income increased $136.2 million, or 16.8%, compared to the twelve months ended December 31, 2007
driven by a decrease in market valuation losses. Additionally, gains on the sale of non-strategic businesses were offset by the
corresponding loss of revenue and lower market valuations on managed equity assets. A $250.5 million increase due to a
market valuation loss in the fourth quarter of 2007 related to securities purchased from our RidgeWorth subsidiary was
partially offset by a $63.8 million market valuation loss on Lehman bonds in 2008. A $29.6 million gain on sale of First
Mercantile in 2008, and $24.1 million of incremental noninterest income from the sale of our Lighthouse Partners investment
also increased income. Retail investment income increased $6.8 million, or 2.5%, due to higher annuity sales and higher
recurring managed account fees. Trust income decreased $91.1 million, or 13.4%, primarily due to the aforementioned sales
of Lighthouse Partners and First Mercantile, which resulted in a $49.1 million decline in trust income as well as lower market
valuations on managed equity assets.
As of December 31, 2008, assets under management were approximately $113.1 billion compared to $142.8 billion as of
December 31, 2007. Assets under management include individually managed assets, the RidgeWorth Funds, managed
institutional assets, and participant-directed retirement accounts. Our total assets under advisement were approximately
$194.5 billion, which includes $113.1 billion in assets under management, $45.7 billion in non-managed trust assets, $31.2
billion in retail brokerage assets, and $4.5 billion in non-managed corporate trust assets.
Total noninterest expense decreased $47.2 million, or 4.6%. This decline includes a $45.0 million impairment charge on a
client based intangible incurred in the second quarter of 2008. Noninterest expense before intangible amortization declined
$85.4 million, or 8.6%, driven by lower staff, discretionary, and indirect expenses, as well as lower structural expenses
resulting from the sales of Lighthouse Partners and First Mercantile.
74


