SunTrust 2009 Annual Report Download - page 111
Download and view the complete annual report
Please find page 111 of the 2009 SunTrust annual report below. You can navigate through the pages in the report by either clicking on the pages listed below, or by using the keyword search tool below to find specific information within the annual report.-
 1
1 -
2
-
3
-
4
-
5
-
6
-
7
-
8
-
9
-
10
-
11
-
12
-
13
-
14
-
15
-
16
-
17
-
18
-
19
-
20
-
21
-
22
-
23
-
24
-
25
-
26
-
27
-
28
-
29
-
30
-
31
-
32
-
33
-
34
-
35
-
36
-
37
-
38
-
39
-
40
-
41
-
42
-
43
-
44
-
45
-
46
-
47
-
48
-
49
-
50
-
51
-
52
-
53
-
54
-
55
-
56
-
57
-
58
-
59
-
60
-
61
-
62
-
63
-
64
-
65
-
66
-
67
-
68
-
69
-
70
-
71
-
72
-
73
-
74
-
75
-
76
-
77
-
78
-
79
-
80
-
81
-
82
-
83
-
84
-
85
-
86
-
87
-
88
-
89
-
90
-
91
-
92
-
93
-
94
-
95
-
96
-
97
-
98
-
99
-
100
-
 101
101 -
 102
102 -
 103
103 -
 104
104 -
 105
105 -
 106
106 -
 107
107 -
 108
108 -
 109
109 -
 110
110 -
 111
111 -
 112
112 -
 113
113 -
 114
114 -
 115
115 -
 116
116 -
 117
117 -
 118
118 -
 119
119 -
 120
120 -
 121
121 -
122
-
123
-
124
-
125
-
126
-
127
-
128
-
129
-
130
-
131
-
132
-
133
-
134
-
135
-
136
-
137
-
138
-
139
-
140
-
141
-
142
-
143
-
144
-
145
-
146
-
147
-
148
-
149
-
150
-
151
-
152
-
153
-
154
-
155
-
156
-
157
-
158
-
159
-
160
-
161
-
162
-
163
-
164
-
165
-
166
-
167
-
168
-
169
-
170
-
171
-
172
-
173
-
174
-
175
-
176
-
177
-
178
-
179
-
180
-
181
-
182
-
183
-
184
-
185
-
186
 |
 |

SUNTRUST BANKS, INC.
Notes to Consolidated Financial Statements (Continued)
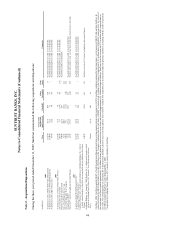
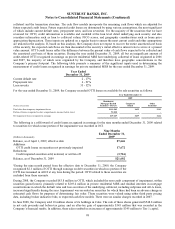
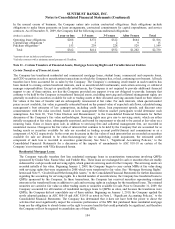
Note 3 - Funds Sold and Securities Purchased Under Agreements to Resell
Funds sold and securities purchased under agreements to resell at December 31 were as follows:
(Dollars in thousands) 2009 2008
Federal funds $54,450 $134,000
Resell agreements 462,206 856,614
Total funds sold and securities purchased under agreements to resell $516,656 $990,614
Securities purchased under agreements to resell are collateralized by U.S. government or agency securities and are carried at
the amounts at which securities will be subsequently resold. The Company takes possession of all securities under
agreements to resell and performs the appropriate margin evaluation on the acquisition date based on market volatility, as
necessary. The Company requires collateral between 100% and 110% of the underlying securities. The total market value of
the collateral held was $464.2 million and $866.7 million at December 31, 2009 and 2008, of which $110.1 million and
$246.3 million was repledged, respectively.
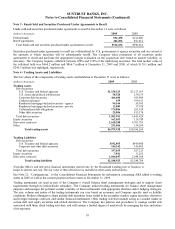
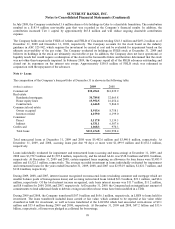
Note 4 - Trading Assets and Liabilities
The fair values of the components of trading assets and liabilities at December 31 were as follows:
(Dollars in thousands) 2009 2008
Trading Assets
Debt securities:
U.S. Treasury and federal agencies $1,150,323 $3,127,635
U.S. states and political subdivisions 58,520 159,135
Corporate debt securities 464,684 585,809
Commercial paper 639 399,611
Residential mortgage-backed securities - agency 94,164 58,565
Residential mortgage-backed securities - private 13,889 37,970
Collateralized debt obligations 174,886 261,528
Other debt securities 25,886 813,176
Total debt securities 1,982,991 5,443,429
Equity securities 163,053 116,788
Derivative contracts12,610,288 4,701,783
Other 223,606 134,269
Total trading assets $4,979,938 $10,396,269
Trading Liabilities
Debt securities:
U.S. Treasury and federal agencies $192,893 $440,408
Corporate and other debt securities 144,142 146,805
Total debt securities 337,035 587,213
Equity securities 7,841 13,263
Derivative contracts11,844,047 2,640,308
Total trading liabilities $2,188,923 $3,240,784
1Excludes IRLCs and derivative financial instruments entered into by the Household Lending line of business to
hedge its interest rate risk. The fair value of these derivatives is included in other assets and liabilities.
See Note 21, “Contingencies,” to the Consolidated Financial Statements for information concerning ARS added to trading
assets in 2008 as well as the current position in those assets at December 31, 2009.
Trading instruments are used as part of the Company’s overall balance sheet management strategies and to support client
requirements through its broker/dealer subsidiary. The Company utilized trading instruments for balance sheet management
purposes and manages the potential market volatility of these instruments with appropriate duration and/or hedging strategies.
The size, volume and nature of the trading instruments can vary based on economic and Company specific asset or liability
conditions. Product offerings to clients include debt securities, loans traded in the secondary market, equity securities, derivative
and foreign exchange contracts, and similar financial instruments. Other trading activities include acting as a market maker in
certain debt and equity securities and related derivatives. The Company has policies and procedures to manage market risk
associated with these client trading activities, and will assume a limited degree of market risk by managing the size and nature
of its exposure.
95