SunTrust 2009 Annual Report Download - page 112
Download and view the complete annual report
Please find page 112 of the 2009 SunTrust annual report below. You can navigate through the pages in the report by either clicking on the pages listed below, or by using the keyword search tool below to find specific information within the annual report.-
 1
1 -
2
-
3
-
4
-
5
-
6
-
7
-
8
-
9
-
10
-
11
-
12
-
13
-
14
-
15
-
16
-
17
-
18
-
19
-
20
-
21
-
22
-
23
-
24
-
25
-
26
-
27
-
28
-
29
-
30
-
31
-
32
-
33
-
34
-
35
-
36
-
37
-
38
-
39
-
40
-
41
-
42
-
43
-
44
-
45
-
46
-
47
-
48
-
49
-
50
-
51
-
52
-
53
-
54
-
55
-
56
-
57
-
58
-
59
-
60
-
61
-
62
-
63
-
64
-
65
-
66
-
67
-
68
-
69
-
70
-
71
-
72
-
73
-
74
-
75
-
76
-
77
-
78
-
79
-
80
-
81
-
82
-
83
-
84
-
85
-
86
-
87
-
88
-
89
-
90
-
91
-
92
-
93
-
94
-
95
-
96
-
97
-
98
-
99
-
100
-
101
-
 102
102 -
 103
103 -
 104
104 -
 105
105 -
 106
106 -
 107
107 -
 108
108 -
 109
109 -
 110
110 -
 111
111 -
 112
112 -
 113
113 -
 114
114 -
 115
115 -
 116
116 -
 117
117 -
 118
118 -
 119
119 -
 120
120 -
 121
121 -
 122
122 -
123
-
124
-
125
-
126
-
127
-
128
-
129
-
130
-
131
-
132
-
133
-
134
-
135
-
136
-
137
-
138
-
139
-
140
-
141
-
142
-
143
-
144
-
145
-
146
-
147
-
148
-
149
-
150
-
151
-
152
-
153
-
154
-
155
-
156
-
157
-
158
-
159
-
160
-
161
-
162
-
163
-
164
-
165
-
166
-
167
-
168
-
169
-
170
-
171
-
172
-
173
-
174
-
175
-
176
-
177
-
178
-
179
-
180
-
181
-
182
-
183
-
184
-
185
-
186
 |
 |

SUNTRUST BANKS, INC.
Notes to Consolidated Financial Statements (Continued)
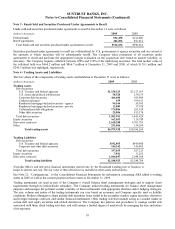
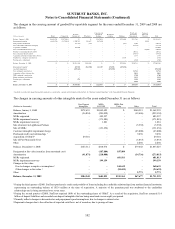
Note 5 - Securities Available for Sale
Securities available for sale at December 31 were as follows:
2009
(Dollars in thousands)
Amortized
Cost
Unrealized
Gains
Unrealized
Losses
Fair
Value
U.S. Treasury and federal agencies $7,939,917 $13,423 $39,229 $7,914,111
U.S. states and political subdivisions 927,887 27,799 10,629 945,057
Residential mortgage-backed securities - agency 15,704,594 273,207 61,724 15,916,077
Residential mortgage-backed securities - private 500,651 6,002 99,425 407,228
Other debt securities 785,728 16,253 4,578 797,403
Common stock of The Coca-Cola Company 69 1,709,931 - 1,710,000
Other equity securities1786,248 918 - 787,166
Total securities available for sale $26,645,094 $2,047,533 $215,585 $28,477,042
2008
(Dollars in thousands)
Amortized
Cost Unrealized Gains
Unrealized
Losses
Fair
Value
U.S. Treasury and federal agencies $464,566 $21,889 $302 $486,153
U.S. states and political subdivisions 1,018,906 24,621 6,098 1,037,429
Residential mortgage-backed securities - agency 14,424,531 135,803 10,230 14,550,104
Residential mortgage-backed securities - private 629,174 8,304 115,327 522,151
Other debt securities 302,800 4,444 13,059 294,185
Common stock of The Coca-Cola Company 69 1,358,031 - 1,358,100
Other equity securities11,443,161 5,254 - 1,448,415
Total securities available for sale $18,283,207 $1,558,346 $145,016 $19,696,537
1Includes $343.3 million and $493.2 million of FHLB of Cincinnati and FHLB of Atlanta stock stated at par value, $360.4 million and $360.9 million
of Federal Reserve Bank stock stated at par value and $82.2 million and $588.5 million of mutual fund investments stated at fair value as of
December 31, 2009 and December 31, 2008, respectively.
The increase in U.S. Treasury and federal agency securities was due to the net purchase of lower-yielding U.S. Treasury and
federal agency securities throughout 2009, which improved the quality and liquidity of the portfolio in anticipation of the
repayment of TARP upon regulatory approval.
In 2009, we sold approximately $9.2 billion of agency MBS recognizing a $90.2 million gain on those sales. These sales
were associated with repositioning the MBS portfolio into securities we believe have higher relative value.
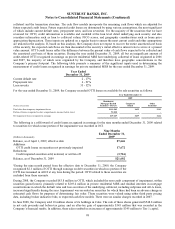
See Note 21, “Contingencies”, to the Consolidated Financial Statements for information concerning ARS classified as
securities available for sale.
Securities available for sale that were pledged to secure public deposits, trusts, and other funds had fair values of $9.0 billion
and $6.2 billion as December 31, 2009 and 2008, respectively.
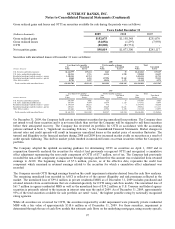
The amortized cost and fair value of investments in debt securities at December 31, 2009 by estimated average life are shown
below. Actual cash flows may differ from estimated average lives and contractual maturities because borrowers may have the
right to call or prepay obligations with or without call or prepayment penalties.
(Dollars in thousands)
1 Year
or Less
1-5
Years
5-10
Years
After 10
Years Total
Distribution of Maturities:
Amortized Cost
Residential mortgage-backed securities - agency $172,218 $11,396,795 $1,160,850 $2,974,731 $15,704,594
All other debt securities 494,881 8,702,265 755,996 201,041 10,154,183
Total debt securities $667,099 $20,099,060 $1,916,846 $3,175,772 $25,858,777
Fair Value
Residential mortgage-backed securities - agency $177,313 $11,592,575 $1,220,845 $2,925,344 $15,916,077
All other debt securities 499,473 8,683,395 691,947 188,984 10,063,799
Total debt securities $676,786 $20,275,970 $1,912,792 $3,114,328 $25,979,876
96