SunTrust 2009 Annual Report Download - page 55
Download and view the complete annual report
Please find page 55 of the 2009 SunTrust annual report below. You can navigate through the pages in the report by either clicking on the pages listed below, or by using the keyword search tool below to find specific information within the annual report.-
 1
1 -
2
-
3
-
4
-
5
-
6
-
7
-
8
-
9
-
10
-
11
-
12
-
13
-
14
-
15
-
16
-
17
-
18
-
19
-
20
-
21
-
22
-
23
-
24
-
25
-
26
-
27
-
28
-
29
-
30
-
31
-
32
-
33
-
34
-
35
-
36
-
37
-
38
-
39
-
40
-
41
-
42
-
43
-
44
-
 45
45 -
 46
46 -
 47
47 -
 48
48 -
 49
49 -
 50
50 -
 51
51 -
 52
52 -
 53
53 -
 54
54 -
 55
55 -
 56
56 -
 57
57 -
 58
58 -
 59
59 -
 60
60 -
 61
61 -
 62
62 -
 63
63 -
 64
64 -
 65
65 -
66
-
67
-
68
-
69
-
70
-
71
-
72
-
73
-
74
-
75
-
76
-
77
-
78
-
79
-
80
-
81
-
82
-
83
-
84
-
85
-
86
-
87
-
88
-
89
-
90
-
91
-
92
-
93
-
94
-
95
-
96
-
97
-
98
-
99
-
100
-
101
-
102
-
103
-
104
-
105
-
106
-
107
-
108
-
109
-
110
-
111
-
112
-
113
-
114
-
115
-
116
-
117
-
118
-
119
-
120
-
121
-
122
-
123
-
124
-
125
-
126
-
127
-
128
-
129
-
130
-
131
-
132
-
133
-
134
-
135
-
136
-
137
-
138
-
139
-
140
-
141
-
142
-
143
-
144
-
145
-
146
-
147
-
148
-
149
-
150
-
151
-
152
-
153
-
154
-
155
-
156
-
157
-
158
-
159
-
160
-
161
-
162
-
163
-
164
-
165
-
166
-
167
-
168
-
169
-
170
-
171
-
172
-
173
-
174
-
175
-
176
-
177
-
178
-
179
-
180
-
181
-
182
-
183
-
184
-
185
-
186
 |
 |
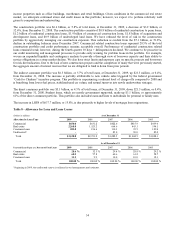
construction to perm, $429 million residential construction, and $641 million in residential land, acquisition, and
development properties. Beginning in September 2007, underwriting standards were tightened for new loan originations in
the construction to perm portfolio. At this point, we believe that the residential construction nonperforming loans are at or
near their peak. The vast majority of the problem loans in the portfolio have been identified and are in the workout process.
As a result, charge-offs will remain elevated, but declining, over the next two to three quarters as we continue workout
activities.
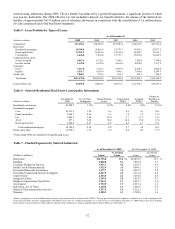
Nonaccrual commercial loans were $484.0 million, up $162.0 million, or 50.3%, from December 31, 2008. The increase was
driven primarily by loans to a few larger commercial borrowers in economically cyclical industries together with loans to
mid-size borrowers. Commercial loan charge-offs, early stage delinquency and nonperforming loans declined in the fourth
quarter. We continue to see some stress in more cyclically sensitive industries and in our small business portfolio.
Nonaccrual commercial real estate loans increased by $215.2 million, or 121.9%, to $391.8 million compared to
December 31, 2008. The increase occurred in a variety of property types, including office and hotel. The composition of
commercial real estate nonaccruals is split almost equally between owner occupied and investor owned loans.
Early stage delinquencies (30-89 days past due) were stable to declining in almost all of our non-residential secured
consumer portfolios. The exception was in the consumer direct portfolio, which is largely comprised of federally guaranteed
or privately insured student loans, and which drove the increase. Excluding student loans, the early stage delinquency ratio
for the consumer direct portfolio was 1.07%. Total early stage delinquencies declined to 1.37% as of December 31, 2009
from 1.52% as of September 30, 2009 and 1.81% as of December 31, 2008.
In order to maximize the collection of loan balances, we evaluate accounts that experience financial difficulties on a
case-by-case basis to determine if their terms should be modified. We are aggressively pursuing modifications when there is
a reasonable chance that the modification will allow the client to continue servicing the debt. For residential real estate
secured loans, if the client demonstrates a loss of income such that the client cannot reasonably support even a modified loan,
we strongly encourage short sales and deed-in-lieu arrangements. Accruing loans with modifications that are deemed to be
economic concessions resulting from borrower difficulties are reported as TDRs. Nonaccruing loans that are modified and
demonstrate a history of repayment performance in accordance with their modified terms are reclassified to accruing
restructured typically after six months of repayment performance. Nonaccruing restructured loans were $912.5 million and
$268.1 million as of December 31, 2009 and December 31, 2008, respectively.
Accruing restructured loans were $1.6 billion at December 31, 2009, an increase of $1.2 billion, or 254.7%, from
December 31, 2008. Of these TDRs, 97% are first and second lien residential mortgages and home equity lines of credit, and
not commercial or commercial real estate loans. At December 31, 2009, specific reserves included in the ALLL for all
consumer real estate TDRs (accruing and nonaccruing) were $345.0 million. In addition, we have already recorded
approximately $140 million in charge-offs on the nonaccruing TDRs and also have $86.0 million in mark to market
adjustments on TDRs carried at fair value. These loans are primarily residential related and are being restructured in a variety
of ways to help our clients remain in their homes and mitigate potential additional loss to us. The primary restructuring
methods offered to our clients are reductions in interest rates and extensions in terms. The increase in loan modifications also
impacted the moderation in nonperforming loan growth and early stage delinquencies. Within the accruing TDR portfolio,
85% of loans are current on principal and interest and 70% of the total TDR portfolio is current. Not all restructurings will
ultimately result in the complete collection of principal and interest, as modified. We anticipate that some of the restructured
loans will default, which could result in incremental losses to us, which has been factored into our overall ALLL estimate.
The level of re-defaults will be affected by future economic conditions. Generally, once a consumer loan becomes a TDR, it
is probable that the loan will likely continue to be reported as TDR until it ultimately pays off in most circumstances.
Interest income on nonaccrual loans, if recognized, is recorded using the cash basis method of accounting. During 2009 and
2008, this amounted to $36.2 million and $25.4 million, respectively. For 2009 and 2008, estimated interest income of
$354.1 million and $233.3 million, respectively, would have been recorded if all such loans had been accruing interest
according to their original contractual terms. Interest income on restructured loans that have met their performance criteria
and have been returned to accruing status is recognized according to the terms of the restructuring. During 2009, this
amounted to $52.2 million. For 2009, estimated interest income of $75.2 million would have been recorded if all loans
returned to accruing status had been accruing interest according to their original contractual terms. During 2008, the
difference between income under original contractual terms and the modified terms for restructured loans was insignificant.
As of December 31, 2009, accruing loans past due ninety days or more increased by $467.6 million, or 45.3%, from
December 31, 2008 to $1.5 billion. Included in this accruing loan population are $978.9 million and $493.7 million of loans
at December 31, 2009 and December 31, 2008, respectively, that have been sold to GNMA and are fully insured by the FHA
and the VA. When loans are sold to GNMA, we retain an option to repurchase the loans when they become delinquent. As
such, we are required to record these loans on our balance sheet when our option becomes exercisable. Also included in the
accruing loans past due ninety days or more as of December 31, 2009 and December 31, 2008 were $366.7 million and
$367.6 million, respectively, of student loans which were federally guaranteed at various levels between 97% and 100%.
39