SunTrust 2009 Annual Report Download - page 154
Download and view the complete annual report
Please find page 154 of the 2009 SunTrust annual report below. You can navigate through the pages in the report by either clicking on the pages listed below, or by using the keyword search tool below to find specific information within the annual report.-
 1
1 -
2
-
3
-
4
-
5
-
6
-
7
-
8
-
9
-
10
-
11
-
12
-
13
-
14
-
15
-
16
-
17
-
18
-
19
-
20
-
21
-
22
-
23
-
24
-
25
-
26
-
27
-
28
-
29
-
30
-
31
-
32
-
33
-
34
-
35
-
36
-
37
-
38
-
39
-
40
-
41
-
42
-
43
-
44
-
45
-
46
-
47
-
48
-
49
-
50
-
51
-
52
-
53
-
54
-
55
-
56
-
57
-
58
-
59
-
60
-
61
-
62
-
63
-
64
-
65
-
66
-
67
-
68
-
69
-
70
-
71
-
72
-
73
-
74
-
75
-
76
-
77
-
78
-
79
-
80
-
81
-
82
-
83
-
84
-
85
-
86
-
87
-
88
-
89
-
90
-
91
-
92
-
93
-
94
-
95
-
96
-
97
-
98
-
99
-
100
-
101
-
102
-
103
-
104
-
105
-
106
-
107
-
108
-
109
-
110
-
111
-
112
-
113
-
114
-
115
-
116
-
117
-
118
-
119
-
120
-
121
-
122
-
123
-
124
-
125
-
126
-
127
-
128
-
129
-
130
-
131
-
132
-
133
-
134
-
135
-
136
-
137
-
138
-
139
-
140
-
141
-
142
-
143
-
 144
144 -
 145
145 -
 146
146 -
 147
147 -
 148
148 -
 149
149 -
 150
150 -
 151
151 -
 152
152 -
 153
153 -
 154
154 -
 155
155 -
 156
156 -
 157
157 -
 158
158 -
 159
159 -
 160
160 -
 161
161 -
 162
162 -
 163
163 -
 164
164 -
165
-
166
-
167
-
168
-
169
-
170
-
171
-
172
-
173
-
174
-
175
-
176
-
177
-
178
-
179
-
180
-
181
-
182
-
183
-
184
-
185
-
186
 |
 |

SUNTRUST BANKS, INC.
Notes to Consolidated Financial Statements (Continued)
Note 19 - Concentrations of Credit Risk
Credit risk represents the maximum accounting loss that would be recognized at the reporting date if borrowers failed to
perform as contracted and any collateral or security proved to be of no value. Concentrations of credit risk (whether on- or
off-balance sheet) arising from financial instruments can exist in relation to individual borrowers or groups of borrowers,
certain types of collateral, certain types of industries, certain loan products, or certain regions of the country.
Credit risk associated with these concentrations could arise when a significant amount of loans, related by similar
characteristics, are simultaneously impacted by changes in economic or other conditions that cause their probability of
repayment to be adversely affected. The Company does not have a significant concentration of risk to any individual client
except for the U.S. government and its agencies. The major concentrations of credit risk for the Company arise by collateral
type in relation to loans and credit commitments. The only significant concentration that exists is in loans secured by
residential real estate. At December 31, 2009, the Company owned $46.7 billion in residential mortgage loans and home
equity lines, representing 41.1% of total loans, $3.8 billion of residential construction loans, representing 3.4% of total loans,
and an additional $15.2 billion in commitments to extend credit on home equity loans and $12.2 billion in mortgage loan
commitments. At December 31, 2008, the Company had $48.5 billion in residential mortgage loans and home equity lines,
representing 38.2% of total loans, $6.2 billion of residential construction loans, representing 4.9% of total loans and an
additional $18.3 billion in commitments to extend credit on home equity loans and $17.0 billion in mortgage loan
commitments. The Company originates and retains certain residential mortgage loan products that include features such as
interest only loans, high LTV loans, and low initial interest rate loans. As of December 31, 2009, the Company owned $15.4
billion of interest only loans, primarily with a 10 year interest only period. Approximately $2.4 billion of those loans had
combined original LTV ratios in excess of 80% with no mortgage insurance. Additionally, the Company owned
approximately $3.0 billion of amortizing loans with combined original LTV ratios in excess of 80% with no mortgage
insurance. The Company attempts to mitigate and control the risk in each loan type through private mortgage insurance and
underwriting guidelines and practices. A geographic concentration arises because the Company operates primarily in the
Southeastern and Mid-Atlantic regions of the United States.
SunTrust engages in limited international banking activities. The Company’s total cross-border outstanding loans were
$572.0 million and $945.8 million as of December 31, 2009 and December 31, 2008, respectively.
Note 20 – Fair Value Election and Measurement
In certain circumstances, fair value enables a company to more accurately align its financial performance with the economic
value of actively traded or hedged assets or liabilities. Fair value enables a company to mitigate the non-economic earnings
volatility caused from financial assets and financial liabilities being carried at different bases of accounting, as well as to
more accurately portray the active and dynamic management of a company’s balance sheet.
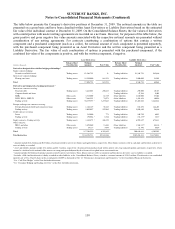
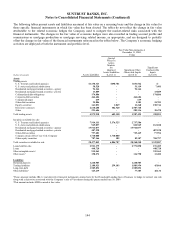
The Company has elected to record specific financial assets and financial liabilities at fair value. These instruments include
all, or a portion, of the following: fixed rate debt, loans, LHFS, brokered deposits, and trading loans. The following is a
description of each financial asset and liability class as of December 31, 2009 for which fair value has been elected,
including the specific reasons for electing fair value and the strategies for managing the financial assets and liabilities on a
fair value basis.
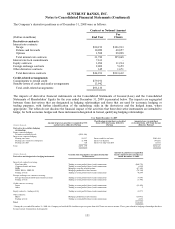
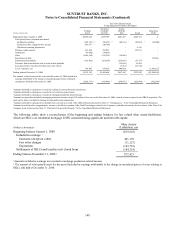
Fixed Rate Debt
The debt that the Company initially elected to carry at fair value was all of its fixed rate debt that had previously been
designated in qualifying fair value hedges using receive-fixed interest rate swaps. The Company has also elected fair
value for specific fixed rate debt issued subsequent to 2006 in which the Company concurrently entered into derivative
financial instruments that economically converted the interest rate on the debt from fixed to floating. The Company
elected to record this debt at fair value in order to align the accounting for the debt with the accounting for the
derivatives without having to account for the debt under hedge accounting, thus avoiding the complex and time
consuming fair value hedge accounting requirements. This move to fair value introduced earnings volatility due to
changes in the Company’s credit spread. As of December 31, 2008, the fair value of all such elected fixed rate debt was
comprised of $3.7 billion of fixed rate FHLB advances and $3.5 billion of publicly-issued debt. In February 2009, the
Company repaid all of the FHLB advances outstanding and closed out its exposures on the interest rate swaps.
Approximately $150.8 million of FHLB stock was redeemed in conjunction with the repayment of the advances. Total
debt carried at fair value debt as of December 31, 2009 had a par value of $3.6 billion.
138