SunTrust 2009 Annual Report Download - page 157
Download and view the complete annual report
Please find page 157 of the 2009 SunTrust annual report below. You can navigate through the pages in the report by either clicking on the pages listed below, or by using the keyword search tool below to find specific information within the annual report.-
 1
1 -
2
-
3
-
4
-
5
-
6
-
7
-
8
-
9
-
10
-
11
-
12
-
13
-
14
-
15
-
16
-
17
-
18
-
19
-
20
-
21
-
22
-
23
-
24
-
25
-
26
-
27
-
28
-
29
-
30
-
31
-
32
-
33
-
34
-
35
-
36
-
37
-
38
-
39
-
40
-
41
-
42
-
43
-
44
-
45
-
46
-
47
-
48
-
49
-
50
-
51
-
52
-
53
-
54
-
55
-
56
-
57
-
58
-
59
-
60
-
61
-
62
-
63
-
64
-
65
-
66
-
67
-
68
-
69
-
70
-
71
-
72
-
73
-
74
-
75
-
76
-
77
-
78
-
79
-
80
-
81
-
82
-
83
-
84
-
85
-
86
-
87
-
88
-
89
-
90
-
91
-
92
-
93
-
94
-
95
-
96
-
97
-
98
-
99
-
100
-
101
-
102
-
103
-
104
-
105
-
106
-
107
-
108
-
109
-
110
-
111
-
112
-
113
-
114
-
115
-
116
-
117
-
118
-
119
-
120
-
121
-
122
-
123
-
124
-
125
-
126
-
127
-
128
-
129
-
130
-
131
-
132
-
133
-
134
-
135
-
136
-
137
-
138
-
139
-
140
-
141
-
142
-
143
-
144
-
145
-
146
-
 147
147 -
 148
148 -
 149
149 -
 150
150 -
 151
151 -
 152
152 -
 153
153 -
 154
154 -
 155
155 -
 156
156 -
 157
157 -
 158
158 -
 159
159 -
 160
160 -
 161
161 -
 162
162 -
 163
163 -
 164
164 -
 165
165 -
 166
166 -
 167
167 -
168
-
169
-
170
-
171
-
172
-
173
-
174
-
175
-
176
-
177
-
178
-
179
-
180
-
181
-
182
-
183
-
184
-
185
-
186
 |
 |
SUNTRUST BANKS, INC.
Notes to Consolidated Financial Statements (Continued)
observable in the current markets. Generally, the Company attempts to obtain pricing for its securities from a third party
pricing provider or third party brokers who have experience in valuing certain investments. This pricing may be used as
either direct support for the Company’s valuation or used to validate outputs from its own proprietary models. Although
third party price indications have been available for the majority of the securities, the significant decrease in the volume
and level of trading activity makes it difficult to support the observability of these quotations. Therefore, the Company
evaluates third party pricing to determine the reasonableness of the information relative to changes in market data based
on any recent trades it executed, market information received from outside market participants and analysts, and/or
changes in the underlying collateral performance. When actual trades are not available to corroborate pricing
information received, the Company will use industry standard or proprietary models to estimate fair value and will
consider assumptions such as relevant market indices that correlate to the underlying collateral, prepayment speeds,
default rates, loss severity rates, and discount rates.
Level 3 loans are primarily non-agency residential mortgage loans held for investment or LHFS for which there is little
to no observable trading activity of similar instruments in either the new issuance or secondary loan markets as either
whole loans or as securities. Prior to the non-agency residential loan market disruption, which began during the third
quarter of 2007 and continues, the Company was able to obtain certain observable pricing from either the new issuance
or secondary loan market. However, as the markets deteriorated and certain loans were not actively trading as either
whole loans or as securities, the Company began employing the same alternative valuation methodologies used to value
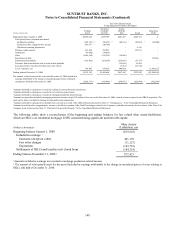
level 3 residential MBS to fair value the loans. In the normal course of business, the Company may elect to transfer
certain fair valued mortgage LHFS to mortgage loans held for investment. During the years ended December 31, 2009
and 2008, the Company transferred $307.0 million and $656.1 million, respectively, of loans that were previously
designated as held for sale to held for investment, as they were determined to be no longer marketable. Of this amount,
$272.1 million during the year ended December 31, 2009, and $83.9 million during the year ended December 31, 2008
were LHFS reported at fair value and will continue to be reported at fair value as loans held for investment.
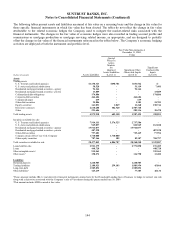
As disclosed in the tabular level 3 rollforwards, during the year ended December 31, 2008, the Company transferred
certain mortgage LHFS into level 3 based on secondary market illiquidity and the resulting reduction of observable
market data for certain non-agency loans requiring increased reliance on unobservable inputs. The transfers into level 3
were not the result of using an alternative valuation approach to estimate fair value that otherwise would have impacted
earnings. Transfers into level 3 during 2009, as shown in the table, were largely due to borrower defaults or the
identification of other loan defects impacting the marketability of the loans.
Additionally, level 3 loans include some of the loans acquired through the acquisition of GB&T. The loans the
Company elected to account for at fair value are primarily nonperforming commercial real estate loans, which do not
trade in an active secondary market. As these loans are classified as nonperforming, cash proceeds from the sale of the
underlying collateral is the expected source of repayment for a majority of these loans. Accordingly, the fair value of
these loans is derived from internal estimates, incorporating market data when available, of the value of the underlying
collateral.
The Company records MSRs at fair value on both a recurring and non-recurring basis. The fair values of MSRs are
determined by projecting cash flows, which are then discounted to estimate an expected fair value. The fair values of
MSRs are impacted by a variety of factors, including prepayment assumptions, discount rates, delinquency rates,
contractually specified servicing fees, and underlying portfolio characteristics. The underlying assumptions and
estimated values are corroborated by values received from independent third parties based on their review of the
servicing portfolio. Because these inputs are not transparent in market trades, MSRs are considered to be level 3 assets
in the valuation hierarchy.
The publicly-issued, fixed rate debt that the Company has elected to carry at fair value is valued by obtaining quotes
from a third party pricing service and utilizing broker quotes to corroborate the reasonableness of those marks. In
addition, information from market data of recent observable trades and indications from buy side investors, if available,
are taken into consideration as additional support for the value. During the third and fourth quarters of 2008, there were
few trades to reference, and therefore, given the continued decline in liquidity for these types of instruments, both in the
secondary markets and for primary issuances, this debt was transferred from a level 2 to a level 3 classification in the
fair value hierarchy effective July 1, 2008. The volume and level of activity for transactions in the Company’s debt in
the secondary markets had begun to increase in the three months ended March 31, 2009 and significantly increased
during the three months ended June 30, 2009. As such, the Company was able to use pricing received from third-party
pricing services and market-makers and therefore elected to transfer its fixed rate debt out of level 3 as of June 30, 2009.
141