SunTrust 2009 Annual Report Download - page 174
Download and view the complete annual report
Please find page 174 of the 2009 SunTrust annual report below. You can navigate through the pages in the report by either clicking on the pages listed below, or by using the keyword search tool below to find specific information within the annual report.-
 1
1 -
2
-
3
-
4
-
5
-
6
-
7
-
8
-
9
-
10
-
11
-
12
-
13
-
14
-
15
-
16
-
17
-
18
-
19
-
20
-
21
-
22
-
23
-
24
-
25
-
26
-
27
-
28
-
29
-
30
-
31
-
32
-
33
-
34
-
35
-
36
-
37
-
38
-
39
-
40
-
41
-
42
-
43
-
44
-
45
-
46
-
47
-
48
-
49
-
50
-
51
-
52
-
53
-
54
-
55
-
56
-
57
-
58
-
59
-
60
-
61
-
62
-
63
-
64
-
65
-
66
-
67
-
68
-
69
-
70
-
71
-
72
-
73
-
74
-
75
-
76
-
77
-
78
-
79
-
80
-
81
-
82
-
83
-
84
-
85
-
86
-
87
-
88
-
89
-
90
-
91
-
92
-
93
-
94
-
95
-
96
-
97
-
98
-
99
-
100
-
101
-
102
-
103
-
104
-
105
-
106
-
107
-
108
-
109
-
110
-
111
-
112
-
113
-
114
-
115
-
116
-
117
-
118
-
119
-
120
-
121
-
122
-
123
-
124
-
125
-
126
-
127
-
128
-
129
-
130
-
131
-
132
-
133
-
134
-
135
-
136
-
137
-
138
-
139
-
140
-
141
-
142
-
143
-
144
-
145
-
146
-
147
-
148
-
149
-
150
-
151
-
152
-
153
-
154
-
155
-
156
-
157
-
158
-
159
-
160
-
161
-
162
-
163
-
 164
164 -
 165
165 -
 166
166 -
 167
167 -
 168
168 -
 169
169 -
 170
170 -
 171
171 -
 172
172 -
 173
173 -
 174
174 -
 175
175 -
 176
176 -
 177
177 -
 178
178 -
 179
179 -
 180
180 -
 181
181 -
 182
182 -
 183
183 -
 184
184 -
185
-
186
 |
 |

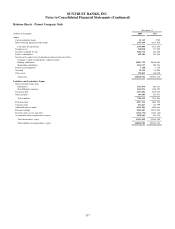
SUNTRUST BANKS, INC.
Notes to Consolidated Financial Statements (Continued)
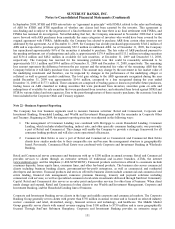
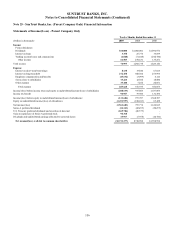
Statements of Cash Flow – Parent Company Only
Year Ended December 31
(Dollars in thousands) 2009 2008 2007
Cash Flows from Operating Activities:
Net income/(loss) ($1,563,683) $795,774 $1,634,015
Adjustments to reconcile net loss to net cash used in operating activities:
Net gain on sale of businesses -(200,851) -
Equity in undistributed loss/(income) of subsidiaries 1,451,997 180,013 (65,428)
Depreciation, amortization and accretion 11,990 4,410 1,028
Stock based compensation 11,406 20,185 24,275
Deferred income tax provision/(benefit) 23,066 (32,725) 17,701
Excess tax benefits from stock-based compensation (387) (4,580) (11,259)
Net loss on extinguishment of debt 31,432 --
Amortization of restricted stock compensation 66,420 76,656 34,820
Net securities gains (7,378) (448) -
Contributions to retirement plans (25,666) (64,016) (11,185)
Net decrease in other assets 49,693 241,423 27,145
Net (decrease)/increase in other liabilities 47,933 (95,978) (272,472)
Net cash provided by operating activities 96,823 919,863 1,378,640
Cash Flows from Investing Activities:
Proceeds from sale of businesses -314,146 -
Net cash equivalents acquired in acquisitions -1,707 -
Proceeds from maturities, calls and repayments of securities available for sale 80,863 16,713 37,355
Proceeds from sales of securities available for sale 38,035 --
Purchases of securities available for sale (5,540,615) (47,237) (214,005)
Proceeds from maturities, calls and repayments of trading securities 128,754 518,600 195,235
Proceeds from sales of trading securities 9,475 402,020 211
Purchases of trading securities (86,559) (214,693) (1,205,136)
Net change in loans to subsidiaries 133,568 47,574 (241,583)
Capital contributions to subsidiaries (20) (268,245) (9,812)
Other, net 2,436 844 904
Net cash (used in)/provided by investing activities (5,234,063) 771,429 (1,436,831)
Cash Flows from Financing Activities:
Net increase/(decrease) in other short-term borrowings 444,142 (1,245,076) 1,594,733
Redemption of real estate investment trust security -- (424,923)
Proceeds from the issuance of long-term debt 574,560 1,549,800 1,000,000
Repayment of long-term debt (672,591) (959,372) (900,572)
Proceeds from the issuance of preferred stock -4,850,000 -
Proceeds from the exercise of stock options -25,569 186,000
Acquisition of treasury stock -- (853,385)
Excess tax benefits from stock-based compensation 387 4,580 11,259
Proceeds from the issuance of common stock 1,829,735 --
Repurchase of preferred stock (228,124) --
Dividends paid (328,673) (1,041,470) (1,056,869)
Net cash provided by/(used in) financing activities 1,619,436 3,184,031 (443,757)
Net increase/(decrease) in cash and cash equivalents (3,517,804) 4,875,323 (501,948)
Cash and cash equivalents at beginning of period 6,312,688 1,437,365 1,939,313
Cash and cash equivalents at end of period $2,794,884 $6,312,688 $1,437,365
Supplemental Disclosures:
Income taxes received from subsidiaries $124,560 $332,802 $734,078
Income taxes paid by Parent Company (710) (313,647) (703,653)
Net income taxes received by Parent Company $123,850 $19,155 $30,425
Interest paid $274,663 $332,481 $344,691
Issuance of common stock for acquisition of GB&T -154,513 -
U.S. Treasury preferred dividends accrued but unpaid 10,777 7,778 -
Accretion of U.S. Treasury preferred stock discount 23,098 3,732 -
Extinguishment of forward stock purchase contract 173,653 --
Gain on repurchase of Series A preferred stock 94,318 --
Noncash capital contribution to subsidiary 151,533 --
158