SunTrust 2009 Annual Report Download - page 163
Download and view the complete annual report
Please find page 163 of the 2009 SunTrust annual report below. You can navigate through the pages in the report by either clicking on the pages listed below, or by using the keyword search tool below to find specific information within the annual report.-
 1
1 -
2
-
3
-
4
-
5
-
6
-
7
-
8
-
9
-
10
-
11
-
12
-
13
-
14
-
15
-
16
-
17
-
18
-
19
-
20
-
21
-
22
-
23
-
24
-
25
-
26
-
27
-
28
-
29
-
30
-
31
-
32
-
33
-
34
-
35
-
36
-
37
-
38
-
39
-
40
-
41
-
42
-
43
-
44
-
45
-
46
-
47
-
48
-
49
-
50
-
51
-
52
-
53
-
54
-
55
-
56
-
57
-
58
-
59
-
60
-
61
-
62
-
63
-
64
-
65
-
66
-
67
-
68
-
69
-
70
-
71
-
72
-
73
-
74
-
75
-
76
-
77
-
78
-
79
-
80
-
81
-
82
-
83
-
84
-
85
-
86
-
87
-
88
-
89
-
90
-
91
-
92
-
93
-
94
-
95
-
96
-
97
-
98
-
99
-
100
-
101
-
102
-
103
-
104
-
105
-
106
-
107
-
108
-
109
-
110
-
111
-
112
-
113
-
114
-
115
-
116
-
117
-
118
-
119
-
120
-
121
-
122
-
123
-
124
-
125
-
126
-
127
-
128
-
129
-
130
-
131
-
132
-
133
-
134
-
135
-
136
-
137
-
138
-
139
-
140
-
141
-
142
-
143
-
144
-
145
-
146
-
147
-
148
-
149
-
150
-
151
-
152
-
 153
153 -
 154
154 -
 155
155 -
 156
156 -
 157
157 -
 158
158 -
 159
159 -
 160
160 -
 161
161 -
 162
162 -
 163
163 -
 164
164 -
 165
165 -
 166
166 -
 167
167 -
 168
168 -
 169
169 -
 170
170 -
 171
171 -
 172
172 -
 173
173 -
174
-
175
-
176
-
177
-
178
-
179
-
180
-
181
-
182
-
183
-
184
-
185
-
186
 |
 |

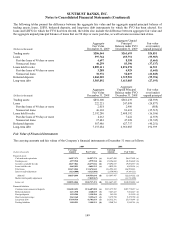
SUNTRUST BANKS, INC.
Notes to Consolidated Financial Statements (Continued)
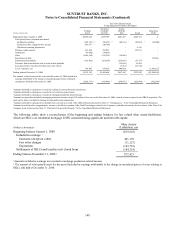
Fair Value Measurement at
December 31, 2008, Using
(Dollars in thousands)
Net
Carrying
Value
Quoted Prices In
Active Markets
for Identical
Assets/Liabilities
(Level 1)
Significant
Other
Observable
Inputs
(Level 2)
Significant
Unobservable
Inputs
(Level 3)
Valuation
Allowance
Loans Held for Sale 1$839,758 - $738,068 $101,690 ($68,154)
MSRs 2794,783 - - 794,783 (370,000)
OREO 3500,481 - 500,481 - (54,450)
Affordable Housing 4471,156 - - 471,156 -
Loans 5178,692 - 178,692 - (34,105)
Other Assets 645,724 - - 45,724 -
Other Intangible Assets 717,298 - - 17,298 -
1These balances are measured at the lower of cost or market.
2MSRs carried at amortized cost are stratified for the purpose of impairment testing with impaired amounts presented herein.
3OREO is recorded at the lower of cost or fair value, less costs to sell.
4Affordable housing was impacted by a $19.9 million impairment charge recorded during the year ended December 31, 2008.
5These balances are measured at fair value on a non-recurring basis using the fair value of the underlying collateral and were impacted by a $34.1 million impairment
charge recorded during the year ended December 31, 2008.
6These assets were impacted by a $27.2 million impairment charge recorded during the year ended December 31, 2008.
7These balances were impacted by a $45.0 million impairment charge recorded during the second quarter of 2008.
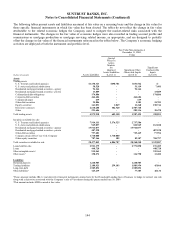
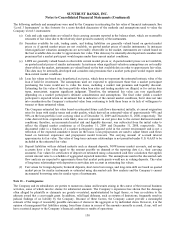
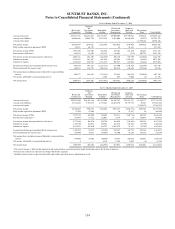
The following tables show a reconciliation of the beginning and ending balances for fair valued assets and liabilities
measured on a recurring basis using significant unobservable inputs (other than MSRs which are disclosed in Note 9,
“Goodwill and Other Intangible Assets”, to the Consolidated Financial Statements):
Fair Value Measurements
Using Significant Unobservable Inputs
(Dollars in thousands)
Beginning balance
January 1, 2009
Included in
earnings
Other
comprehensive
income
Purchases, sales,
issuances,
settlements,
maturities
paydowns, net
Transfers
to/from other
balance sheet line
items
Level 3
transfers, net
Fair value
December 31, 2009
Change in unrealized
gains/(losses) included
in earnings for the
year ended
December 31, 2009
related to financial
instruments still
held at
December 31, 2009
Assets
Trading assets
U.S. Treasury and federal agencies $645,260 ($3,221) 1$- ($181,154) $- ($460,885) $- $-
U.S. states and political subdivisions 7,326 (324) 1, 5 - 399 - - 7,401 (324) 1
Residential mortgage-backed
securities—private 37,970 1,420 1- (25,501) - - 13,889 (7,150) 1
Collateralized debt obligations 261,528 (3,630) 1, 5 - (83,012) - - 174,886 556 1
Corporate debt securities 6,650 2,800 1- (9,450) - - - -
Commercial paper - - - 1,295,355 - (1,295,355) - -
Other debt securities 22,945 1,138 1, 5 - 620 - - 24,703 907 1
Equity securities 101,964 6,343 1, 5 - 42,437 - - 150,744 2,300 1
Derivative contracts 249,547 569 1(250,116) 6-----
Other 58,195 (10,890) 1- (4,019) - (24,816) 18,470 9,131 1
Total trading assets 1,391,385 (5,795) 1, 5 (250,116) 1,035,675 - (1,781,056) 390,093 5,420 1
Securities available for sale
U.S. states and political subdivisions 79,262 5,555 2, 5 (3,495) 47,650 - 3,136 132,108 -
Residential mortgage-backed
securities—private 522,151 (21,455) 229,669 (123,137) - - 407,228 (19,149) 2
Other debt securities 28,413 288 2, 5 2,872 46,381 - - 77,954 -
Other equity securities 859,779 (212) 2(4,378) (150,392) - - 704,797 -
Total securities available for sale 1,489,605 (15,824) 2, 5 24,668 (179,498) - 3,136 1,322,087 (19,149) 2
Loans held for sale 487,445 (8,413) 3- (81,742) (279,367) 33,562 151,485 (19,345) 3
Loans 270,342 1,687 4- (71,603) 262,602 (14,308) 448,720 14,593 4
Other assets/(liabilities), net 72,421 629,973 3- (40,370) (696,676) - (34,652) 5,718
Liabilities
Trading liabilities - - (45,866) 6- - - (45,866) -
Long-term debt (3,496,261) 130,612 1- - - 3,365,649 - -
1Amounts included in earnings are recorded in trading account profits/(losses) and commissions.
2Amounts included in earnings are recorded in net securities gains/(losses).
3Amounts included in earnings are net of issuances, fair value changes, and expirations and are recorded in mortgage production related income.
4Amounts are generally included in mortgage production related income except $2.4 million for the year ended December 31, 2009 related to loans acquired in the GB&T acquisition.
The mark on these loans is included in trading account profits and commissions.
5Amounts included in earnings do not include losses accrued as a result of the auction rate securities settlement discussed in Note 21, “Contingencies,” to the Consolidated Financial Statements.
6Amount recorded in other comprehensive income is the effective portion of the cash flow hedges related to the Company’s probable forecasted sale of its shares of the Coca-Cola Company stock as discussed in Note 17, “Derivative Financial
Instruments,” to the Consolidated Financial Statements.
147