SunTrust 2009 Annual Report Download - page 75
Download and view the complete annual report
Please find page 75 of the 2009 SunTrust annual report below. You can navigate through the pages in the report by either clicking on the pages listed below, or by using the keyword search tool below to find specific information within the annual report.-
 1
1 -
2
-
3
-
4
-
5
-
6
-
7
-
8
-
9
-
10
-
11
-
12
-
13
-
14
-
15
-
16
-
17
-
18
-
19
-
20
-
21
-
22
-
23
-
24
-
25
-
26
-
27
-
28
-
29
-
30
-
31
-
32
-
33
-
34
-
35
-
36
-
37
-
38
-
39
-
40
-
41
-
42
-
43
-
44
-
45
-
46
-
47
-
48
-
49
-
50
-
51
-
52
-
53
-
54
-
55
-
56
-
57
-
58
-
59
-
60
-
61
-
62
-
63
-
64
-
 65
65 -
 66
66 -
 67
67 -
 68
68 -
 69
69 -
 70
70 -
 71
71 -
 72
72 -
 73
73 -
 74
74 -
 75
75 -
 76
76 -
 77
77 -
 78
78 -
 79
79 -
 80
80 -
 81
81 -
 82
82 -
 83
83 -
 84
84 -
 85
85 -
86
-
87
-
88
-
89
-
90
-
91
-
92
-
93
-
94
-
95
-
96
-
97
-
98
-
99
-
100
-
101
-
102
-
103
-
104
-
105
-
106
-
107
-
108
-
109
-
110
-
111
-
112
-
113
-
114
-
115
-
116
-
117
-
118
-
119
-
120
-
121
-
122
-
123
-
124
-
125
-
126
-
127
-
128
-
129
-
130
-
131
-
132
-
133
-
134
-
135
-
136
-
137
-
138
-
139
-
140
-
141
-
142
-
143
-
144
-
145
-
146
-
147
-
148
-
149
-
150
-
151
-
152
-
153
-
154
-
155
-
156
-
157
-
158
-
159
-
160
-
161
-
162
-
163
-
164
-
165
-
166
-
167
-
168
-
169
-
170
-
171
-
172
-
173
-
174
-
175
-
176
-
177
-
178
-
179
-
180
-
181
-
182
-
183
-
184
-
185
-
186
 |
 |

returns and the benefits recognized and measured in accordance with the relevant accounting guidance for income taxes. The
UTBs are based on various tax positions in several jurisdictions and, if taxes related to these positions are ultimately paid, the
payments would be made from our normal, operating cash flows, likely over multiple years.
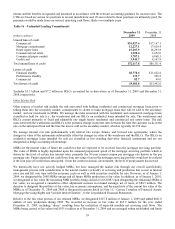
Table 16 – Unfunded Lending Commitments
(Dollars in millions)
December 31
2009
December 31
2008
Unused lines of credit
Commercial $35,027.6 $37,167.1
Mortgage commitments112,227.1 17,010.4
Home equity lines 15,207.9 18,293.8
Commercial real estate 1,922.4 3,652.0
Commercial paper conduit 3,787.1 6,060.3
Credit card 3,945.7 4,167.8
Total unused lines of credit $72,117.8 $86,351.4
Letters of credit
Financial standby $8,778.6 $13,622.8
Performance standby 139.7 220.2
Commercial 82.7 99.0
Total letters of credit $9,001.0 $13,942.0
1Includes $3.3 billion and $7.2 billion in IRLCs accounted for as derivatives as of December 31, 2009 and December 31,
2008, respectively.
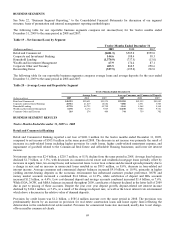
Other Market Risk
Other sources of market risk include the risk associated with holding residential and commercial mortgage loans prior to
selling them into the secondary market, commitments to clients to make mortgage loans that will be sold to the secondary
market, and our investment in MSRs. We manage the risks associated with the residential and commercial mortgage loans
classified as held for sale (i.e., the warehouse) and our IRLCs on residential loans intended for sale. The warehouses and
IRLCs consist primarily of fixed and adjustable rate single family residential and commercial real estate loans. The risk
associated with the warehouses and IRLCs is the potential change in interest rates between the time the customer locks in the
rate on the anticipated loan and the time the loan is sold on the secondary market, which is typically 60-150 days.
We manage interest rate risk predominantly with interest rate swaps, futures, and forward sale agreements, where the
changes in value of the instruments substantially offset the changes in value of the warehouse and the IRLCs. The IRLCs on
residential mortgage loans intended for sale are classified as free standing derivative financial instruments and are not
designated as hedge accounting relationships.
MSRs are the present value of future net cash flows that are expected to be received from the mortgage servicing portfolio.
The value of MSRs is highly dependent upon the assumed prepayment speed of the mortgage servicing portfolio which is
driven by the level of certain key interest rates, primarily the 30-year current coupon par mortgage rate known as the par
mortgage rate. Future expected net cash flows from servicing a loan in the mortgage servicing portfolio would not be realized
if the loan pays off earlier than anticipated. Given the current economic environment, the level of prepayments has slowed.
We historically have not actively hedged MSRs, but have managed the market risk through our overall asset/liability
management process with consideration to the natural counter-cyclicality of servicing and production that occurs as interest
rates rise and fall over time with the economic cycle as well as with securities available for sale. However, as of January 1,
2009, we designated the 2008 MSRs vintage and all future MSRs production at fair value. In addition, as of January 1, 2010,
we designated at fair value the remaining MSR portfolio being carried at LOCOM. Upon designating the remaining MSRs at
fair value, we recognized a cumulative effect adjustment increase in retained earnings, net of taxes, of $88.5 million. The
decision to designate the portfolio at fair value, key economic assumptions, and the sensitivity of the current fair value of the
MSRs as of December 31, 2009 and 2008 is discussed in greater detail in Note 11, “Certain Transfers of Financial Assets,
Mortgage Servicing Rights and Variable Interest Entities”, to the Consolidated Financial Statements.
Relative to the fair value portion of our retained MSRs, we designated $187.8 million at January 1, 2009 and added $681.8
million of new production during 2009. We recorded an increase in fair value of $65.9 million for the year ended
December 31, 2009, including “decay” resulting from the realization of expected monthly net servicing cash flows. The
MSRs being carried at fair value total $935.6 million as of December 31, 2009 and are managed within established risk limits
59